Spatial Environmental Inequality in Lubbock, Texas
Perry Labron Carter 1  , Jason M. Post 2 * and Cynthia L. Sorrensen 3
1Department of Geography, Texas Tech University, 79409 Texas, USA .
2Department of Geographic Information Technology, Navajo Technical University, New Mexico .
3Independent Scholar, .
http://dx.doi.org/10.12944/CRJSSH.1.1.01
Environmental inequality assumes a near proximity of environmental health hazards, hazardous waste processing and releasing facilities to minority and low-income communities. Research in environmental inequality and environment justice over the past twenty years suggests that hazardous waste facilities are often located near minority and low-income neighborhoods. We conducted a study evaluating and quantifying environmental inequality in Lubbock County, Texas. Our study analyzed both spatial and statistical relationships between population demographics and spatial proximity to hazardous waste releasing facilities. Hazardous waste facility data used in the study were collected from the Environmental Protection Agency Toxic Release Inventory (TRI). Population statistics from the U.S. Census comprise the demographic data for this analysis. Spatial regression models were estimated to evaluate the relationship between distance from TRI sites and neighborhood / census block group demographics. A statistically significant relationship with proximity to hazardous waste facilities was found in communities having significant minority populations.
Copy the following to cite this article:
Post J. M, Carter P. L, L. C, Sorrensen S. 2018 “Spatial Environmental Inequality in Lubbock, Texas”Current Research Journal of Social Sciences and Humanities 1(1).
DOI:http://dx.doi.org/10.12944/CRJSSH.1.1.01Copy the following to cite this URL:
Post J. M, Carter P. L, L. C, Sorrensen S. 2018 “Spatial Environmental Inequality in Lubbock, Texas”Current Research Journal of Social Sciences and Humanities 1(1). Available From: http://journalofsocialsciences.org/article/1/
Download article (pdf) Citation Manager Review / Publish History
Introduction
The issue of environmental inequality has sparked a high volume of research since the late 1980s. Factories, waste sites, intermodal rail yards and chemical processing plants are examples of facilities that pose a health risk to local residents due to the hazardous materials processed and stored there. Many such facilities havehistorically been located in industrial zones adjacent to or occupied by low-income communities.1,2 When low-income and high minority concentrations overlap with exposure to hazardous waste this situation has been termed environmental inequality.3,4,5
Large urban areas such as Chicago, Detroit, Houston, and Los Angeles have all been the focus of environmental inequality research. Debates have considered whether co-location of hazardous waste facilities and low-income and minority communities in U.S. cities is discriminatory.6,7 These debates have also focused on what data, methods, spatial scales of analysis, and urban contexts to employ in studies of environmental racism.8,9
While large urban areas have been studied, the potential environmental inequalities within small to mid-sized cities have garnered less attention.10,11 Much of the urban population in the U.S. lives in small to mid-sized cities.12 Smaller cities may provide large pools of low-wage labor, which polluting industries may find attractive, and small cities may seek out these types of industries in an effort to boost their economies. The history and discourse of urban development in smaller cities tends to be less studied and hence, the roots of the co-location of industrial zones and low-income and minority communities in these sub-metropolitan areas remain poorly understood.13
To add to our understanding of environmental inequality in the U.S., this project focuses on Lubbock County, Texas, situated in the South Plains of the Texas panhandle. The County is predominately dominated by cotton fields and open rangeland but contains one census designated urbanized area—the City of Lubbock, which is the residence of approximately 82 percent of the county’s population (population 236,065 - U.S. Census 2012); one urban place—Slaton (U.S. Census, 2012); and a handful of smaller settlements. The aim of this study is to identify communities in Lubbock County that exist within relatively close proximity to environmental hazard sites. Using GIS and spatial analysis, we examine the relationship between distance to facilities releasing hazardous substances and the spatial distribution of income, race across Lubbock County. Our assertion is that while spatial analysis reveals contemporary patterns, a history of segregation is responsible for the co-location of industrial zones and minority residences. Segregation is no longer legislated, but historic patterns persist exposing certain minority groups to potential hazards and creating environmental inequality on the South Plains.
We begin with a discussion of the historic patterns of segregation within Lubbock and the major debates and challenges within the environmental inequality literature. Next, we present the data and methods used to decipher spatial patterns of hazardous waste in relation to residential neighborhood characteristics anddiscuss the implications of our findings. We conclude with the contention that the past is very much alive in Lubbock County. An example of lag causation, historic patterns of segregation are still visible through inequalities in location of and proximity to environmental hazards.
Background
Originally part of Comanchería (the Comanche empire), Lubbock county wassettled by Whites in 1890 after the defeat of the Comanches in 1877.14 Incorporated in 1909 the city of Lubbock grew rapidly with the extension of the Santa Fe Railroad. The 1920s cotton boom drew the first significant numbers of Hispanics and Blacks as agricultural laborers. In these early years, Hispanics were largely an itinerant population, whiles Blacks began to settle on the city’s outskirts.15,16 As early as 1909, anti-Black sentiment in Lubbock was exemplified in Whites fear that the African-American population would cause an increase in crime and a decrease in property values.16 This hostile sentiment towards the Black community came before the city actually had permanent African-American residents. Prior to 1910, the Black population of Lubbock County consisted of servants and farm workers, none of whom had established permanent residency.16 This, however changed when the first African Americans purchased property in Lubbock County between 1913 and 1915.16 Both the City of Lubbock and smaller surrounding communities had codified housing segregation ordinances, yet these small communities did not gain significant minority populations until the later 20th century.
In the 1920’s, the developing African-American community experienced its first documented case of environmental inequality. The homes in African-American neighborhoods consisted mainly of dirt dugouts and shacks built with scrap metal and wood. Sanitary conditions were horrendous as there were no sewage lines or indoor toilet facilities. Having telephone and telegraph service by 1913, the City of Lubbock was considered a modern city, however; these utilities were not extended to African-American neighborhoods.16The growing African-American community in Lubbock centered on the 1900 block of Avenue A (Foster 1974).16 Legislation and city planning documents show numerous attempts to keep the Black neighborhoods embedded within and along the city’s industrial corridor (City of Lubbock 1943). 16
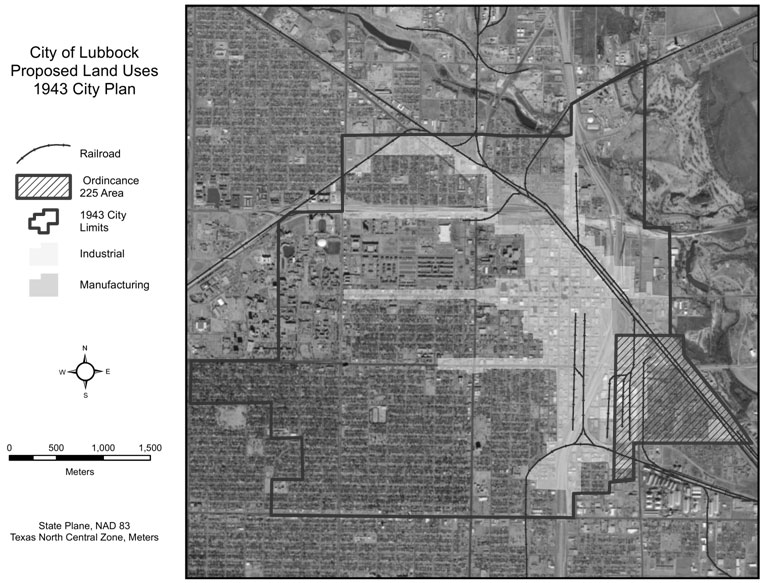 | Figure 1: A 2015 Satellite imageof the city of Lubbock with the 1943 city plan superimposed |
One such attempt was Lubbock City Ordinance 223.Lubbock City Ordinance 223 prohibited any person with at least one eighth African American blood from living outside of an area bounded by Avenue C on the west end, and 16th street at the northern (Figure 1). The city was able to restrict the African American population to a small area by labeling Black communities “dangerous to the health” and proclaiming that African American communities pollute “the earth and atmosphere” (City of Lubbock 1923).16,17The 1943 City Plan was a spatial blue print for a future Lubbock. This plan mentions that the areas encompassed by City Ordinance 223 were undesirable for white residents (Figure 1). The plan further designates these areas as optimal for industrial development and heavy manufacturing, a pattern that still exists today. City Ordinance 223 was not declared null and void by the city until the year 2006.18
While the Hispanic population of Lubbock did not experience segregation to the extent thatof the African-American population, studies such as Sorrensen, Carter, and Phelps show that later development situated many hazardous waste facilities and industrial land uses in predominantly Hispanic neighborhoods.19 A Lubbock native, Robert Narvaiz, provides an example of the spatial constraints that existed for the Hispanic community in the city.
"I remember when I first came to Lubbock, Avenue H was about as far as we could go," said Robert Narvaiz, who has lived in Lubbock since 1956. “If we went beyond Avenue H, we couldn't go into those stores. I went into the service in l958 and got out in 1962, and when I got back to Lubbock I found that everything was still about the same. I remember thinking that I went into the service to fight for my country and then get back home and had to fight again."20
In addition to Industrial development, residential zoning divided the east side of Lubbock from the rest of the city, placing Hispanic and Black communities within industrial zones. Original proposals in the 1910s for the rail road that would ship cotton produced in the region to textile mills in the east had tracks routed through the affluent White neighborhood of Overton, a mile west ofthe Central Business District (CBD). While placing the rail conveniently close to the CBD upon realizing the potential impact on Overton residents, city officials hurriedly cancelled the proposal. The final routing placed the railroad diagonally north to southeast of the CBD. The tracks formed a symbolic barrier between White Lubbock and Hispanic and Black Lubbock. Cattle feed lots and other industrial activities began to emerge along the railway and city land-use policies eventually followed suit. As the industrial corridor grew it expanded further into residential neighborhoods on the north and east sides.19
Literature Review
Our understanding of the spatial coincidence of environmental risks and disadvantaged populations hasadvanced greatly over the past 30 years. Since the seminal United Church of Christ’s 1987 report,Toxic Waste and Race in the United States, the study of these co-occurrences has revealed the numerous ways in which minority communities are threatened by close proximity to environmental health hazards.21,22 Understanding environmental disparity has gone from measuring specific exposure to hazardous materials, to measuring access to environmental amenities, to excavating archives for traces of the exclusion of minorities in the mainstream debates of the environmental movement of the 1970s and 1980s.6, 23 Today a range of terminology is applied—environmental justice, environmental racism and environmental inequity. Inserting the notion of racism has brought particular debate. Whereas Pulido broadens our understanding of racism to include structural processes and their discriminatory outcomes, whether intentional or not, others hold tointentionally as inherent in racism and look to legal decisions as definitive measures of whether discrimination is apparent.7,24,25 In these legal scenarios, many studies have produced evidence of strong environmental inequality, but few have shown evidence of intentional discrimination. Still, most studies hold race as a fundamental factor in understanding environmental disparity.
Thus far, most research on this topic has been predominantly case study oriented. Initial work analyzed environmental inequality in large cities with significant minority populations. Detroit, Los Angeles, Baltimore, Chicago and Dallas have been used extensively in environmental inequality research.26,27,28 Within this work, rich historical contexts are used to explain the spatial associations between race, ethnicity, and environmental conditions. A newer generation of research has extended focus to rural areas and smaller cities, looking at water, sanitation, and grassroots mobilizations.29,30 This work emphasizes the greater reliance on environmental amenities of rural communities.31
Statistical associations between environmental conditions and demographics has been presented as evidence in demonstrating environmental inequities across varying geographic contexts. Yet inconsistencies are apparent. Datasets used for demographic information are often not equivalent in terms of spatial scale.32 Work performed at the county level fails to provide sufficient detail as to what might be occurring at community and neighborhood scales.33 Demographics can vary greatly, even when using the same spatial units.34 Many prior environmental inequality studies assume spatial coincidence—the notion that theoretical exposure from hazardous waste emitting facilities is restricted to a defined geographic boundary.9 Studies such as use zip codes and counties, which can be too large to successfully detect spatial coincidence.27 Some of these challenges can be avoided with the use of buffer and nearest-neighbor analyses.9 Buffer/proximity analysis is commonplace in environmental inequality literature as the method allows researchers to analyze areas without using formal, often census, geographies.9,34
Data used to represent environmental hazards is a common source of inaccuracies as well because it tends to originate from multiple databases collected over different time frames (often outdated) with varying methods and levels of accuracyand scale.33,34 Uniformity across environmental justice research studies in hindered by governmental agencies differing in how they collect data, variations existing in the types of noxious sites used in studies, and a lack of a universal standard for measuring environmental inequality.7,33,34 Air pollution, proximity to hazardous waste sites, tree canopy cover, residential property values, contaminated food and water supplies as well as rat bites have all been used as metrics for quantifying environmental inequality.19,33,34,35 Very few studies actually use facility-specific Environmental Protection Agency (EPA) data. Also, who constitutes the social groups experiencing injustice also varies.37All of these issues lead to inconsistencies in describing environmental inequality, and in understanding the relationship between environmental injustice and community-level environmental health.7
Our study contributes to research the voids outlined above. This project examines environmental health hazards clustering. It aims to quantify environmental inequality.
Materials and Methods
Demographic Data
Population statistics were obtained from the U.S. Census’s 2011 edition of the 5-year American Community Survey (ACS). These data are estimates for the period 2006 to 2011. This study was conducted at the block group level as it is the smallest U.S. Census spatial unit in which full reporting of demographic data is available. There are 204 censusblock groups in Lubbock County.
Table 1: Descriptive statistics for the dependent variable (Distance) and the independent variables (Percent Minority and Median household income).
Descriptive Statistics of Model Variables | |||
| Distance (m) | Percent Minority Population | Median Household Income ($) |
Min. | 131.56 | 0.6 | 0.00 |
Median | 2,574.61 | 12 | 41,875.00 |
Mean | 3,044.30 | 19.57 | 45,614.17 |
Max. | 17,288.94 | 98.1 | 184,083.00 |
Standard Deviation | 2,340.94 | 20.99 | 25,245.42 |
Table 1 shows descriptive statistics for the variables used in this study. Distance is measuredin meters between a block group’s centroid and the nearest toxic waste emitting facility. Percent minority is the proportion of non-white as well as Hispanics within a block group. Median income is a measure of typical household incomes within a block group.
EPA Facility Data
All toxic waste emitting facilities data were collected from the Environmental Protection Agency’s (EPA) Region 6 Facility Registration System (FRS). This point layer locates all facilities belonging to the eight different EPA regulatory programs for toxic waste emitting and generating facilities. Facilities belonging to all eight programs allow for a more complete analysis of impact on, and inequality between communities in Lubbock. This facilities dataset contains information on chemicals releases inspections and compliance. In all, there are 67 facilities located throughout Lubbock County. These facilities combined released 72.575 kg. (160,407.16 lbs) of hazardous chemicals during the 2012 inspection year. Of the 67 facilities in the county, 48 are located within the city of Lubbock’s boundaries.
While not every facility released hazardous waste throughout the inspection year, some facilities are allotted certain volumes of releases should it become necessary. Figure 2 shows the facilities in Lubbock County that are actively releasing waste into the air. These are symbolized by the quantity of waste being released in pounds.
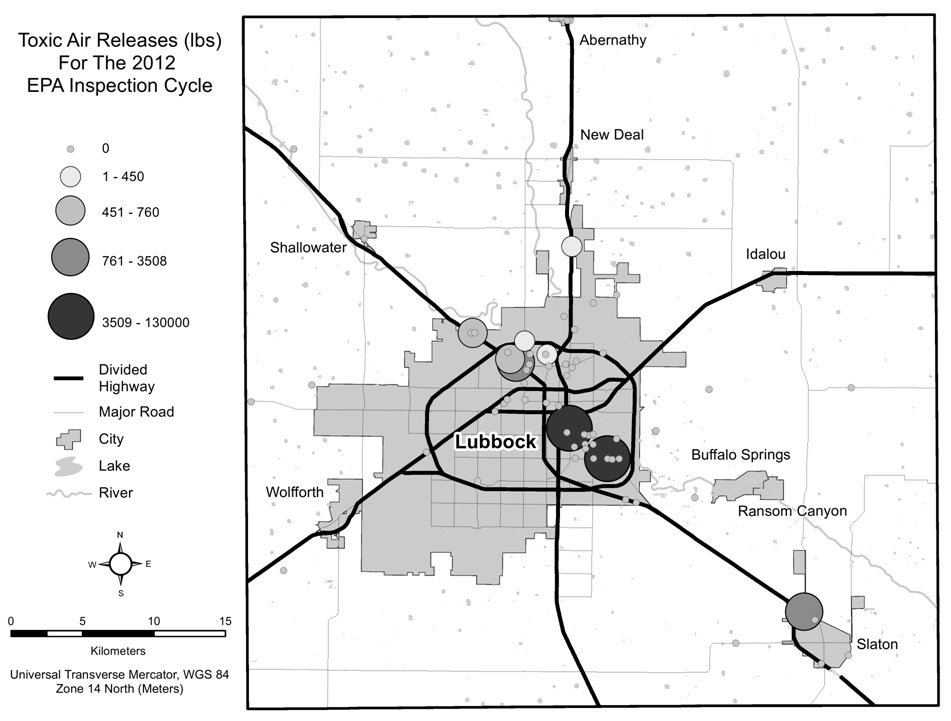 | Figure 2: Toxic Facilities in Lubbock County and the amount of toxins released into the air in 2012 |
The following maps (Figures 3 and 4) visualize the variables used in this study. A clear spatial association exists between percentage minority population and household income. Block groups with the lowest median household incomeswere found to contain the highest percentages of African American and Latino/Hispanic residents and also contain the highest concentration of hazardous waste releasing facilities. It is also important to note how closely these spatial associations follow the historic Lubbock City Ordinance 223 seen in Figure 1.
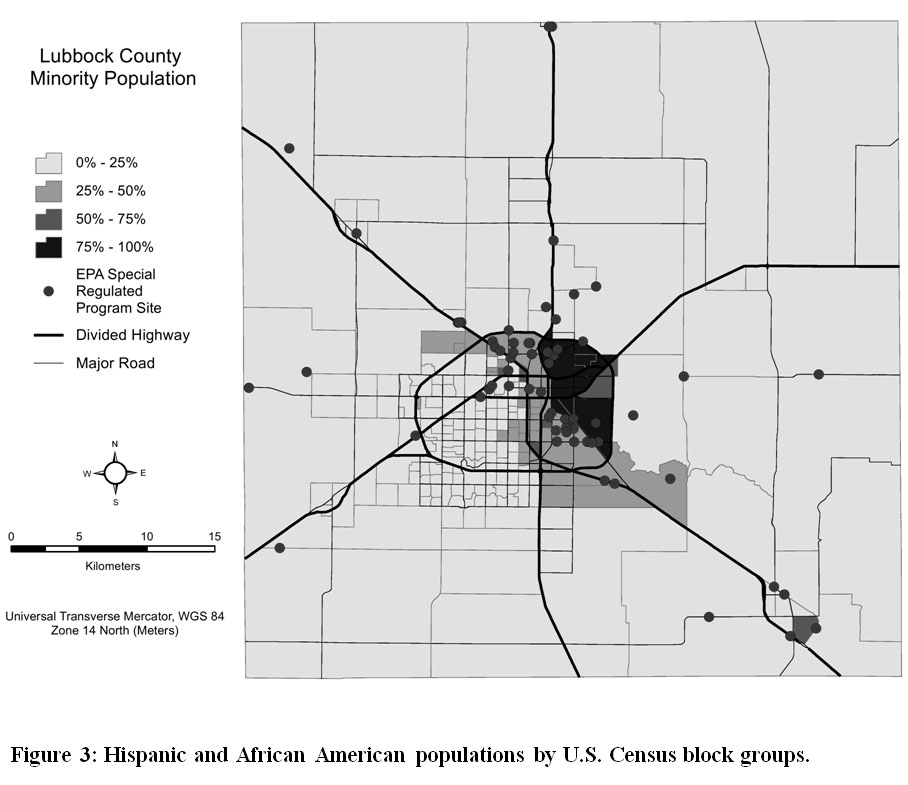 | Figure 3: Hispanic and African American populations by U.S. Census block groups. Click here to view figure |
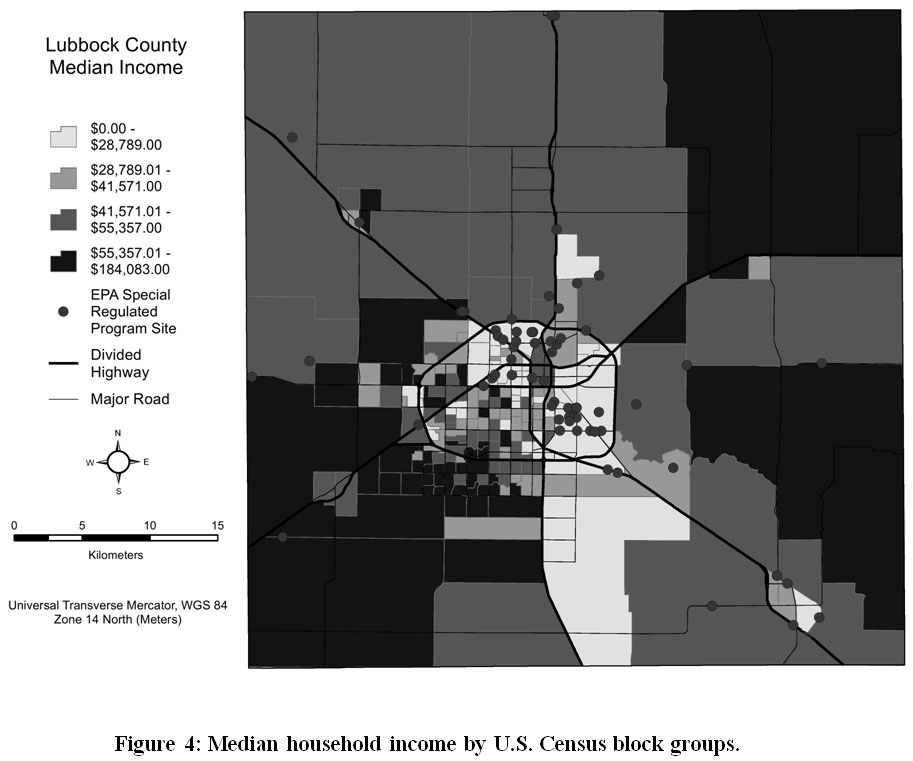 | Figure 4: Median household income by U.S. Census block groups. Click here to view figure |
Results
A regression analysis and spatial regression analysis were performed using percent minority population and median household income as explanatory variables with the dependent variable being nearest neighbor distance from census block group centroids to toxic waste facilities. The percent minority variable was logged due it being highly skewed.
Figure 3 and 4 show the spatial distribution of the minority population in Lubbock County. The spatial distribution of the minority populationis decidedly concentrated. A visible pattern appears where the minority population is clustered in the north eastern and eastern portions of the city. Since a spatial pattern can be seen, the distribution was tested for spatial autocorrelation, and a statistically significant Moran’s I coefficient(11.49) verifies that spatial auto correlation does exist(Table 2).38,39
Table 2: Spatial dependence diagnostics
Diagnostics for Spatial Dependence | |||
Test | MI/DF | Value | p-Value |
| Moran's I (error) | 0.461 | 11.493 | 0.00000 |
| Lagrange Multiplier (lag) | 1 | 148.257 | 0.00000 |
| Robust LM (lag) | 1 | 28.491 | 0.00000 |
| Lagrange Multiplier (error) | 1 | 120.200 | 0.00000 |
| Robust LM (error) | 1 | 0.433 | 0.51039 |
| Lagrange Multiplier (SARMA) | 2 | 148.691 | 0.00000 |
Table 3: OLS Regression results
Table 3 shows the OLS regression results. A statistically significant relationship was observed for both explanatory variables. Using Anselin’s spatial regression decision process, the Lagrange Multiplier diagnostics (Table 2) were reviewed to determine if spatial auto correlation error in the OLS warranted the employment of a spatial lag model or a spatial error model.40 Since all Lagrange Multiplier diagnostics were significant except the Robust LM (error), Anselin’s decision process suggests the employment of a spatial lag model to attenuate the effect of spatial autocorrelation.Spatial auto correlation violates the assumption that regression error terms are independent.41 To account for this lack of independence, a spatial lag regression model was executed using a queen’s contiguity weight matrix.
Table 4: Spatially lag regression model results
Spatial Lag Model - Maximum Likelihood Estimation | ||||
r2 = 0.695 | ||||
Variable | Coefficient | Std. Error | z-Value | p-Value |
| Lagged Distance | 0.786 | 0.048 | 16.252 | 0.00000 |
| CONSTANT | 821.663 | 455.558 | 1.804 | 0.07129 |
| Median Income | 0.008 | 0.004 | 1.918 | 0.05510 |
| Ln Percent Minority | -224.569 | 112.985 | -1.988 | 0.04686 |
Diagnostics for Spatial Dependence - Lag Dependence | ||||
Test | DF | Value | p-Value | |
| Likelihood Ratio Test | 1 | 133.864 | 0.00000 | |
The results of spatial regression suggest that a significant statistical relationship exists between the nearest neighbor distance from census block group centroids to toxic waste facilities and percent minority population. Even after spatial lagging the model, a statistically significant relationship remains, however the variable median household income changes from being statistically significant in the ordinary least squares model to being slightly statistically insignificant in the spatial lag model (Table 4). Additionally, the spatial lag model increased the model's r2 value from 0.315 to 0.695.
After ameliorating spatial auto correlation, the relationship between nearest neighbor distance to a toxic waste facility is estimated to decreases by 224.57 meters per one log unit of percent minority population. Stated another way, the average non-white or Hispanic resident of Lubbock lives approximately 245.59 yards or two and a half football fields away from a toxic waste emitting facility. These resultsillustrate that most of the minority population of Lubbock County is located inclose proximity to environmental health hazard sites.
The spatial lag model reveals that the relationship observed between the nearest neighbor distance to a toxic waste facility and median income was nearly statistically significant(p-value = 0.0551). While this relationship may not be statistically significant, the p-value suggests that there is some effect median income exerts with respect to proximity to environmental health hazards. For Lubbock County as well as most places in the United States, minority status and income are linked. This has to do with the history of race and minority status in the United States. The negative correlation (-0.444) of percent minority population of a block group with median household income suggests the spatial relationship between minority status and home value. This relationship in combination with the spatial lag variable may have caused the loss of statistical significance.
Discussion
This project examines the co-location of toxic waste releasing sites, and minority and low-income communities in Lubbock, Texas as a case study that attempts to quantify spatial environmental inequality. In Lubbock, spatial inequality exists, where by minority and low-income communities are located in closer proximity to toxic waste releasing sites than White, and higher income neighborhoods. The analysis reveals associations between proximity to toxic waste releasing facilities, race and income, and strongly suggest actual relationships between these variables. This supports the supposition that there exists inequality between racial, ethnic and economic groups in terms of where hazardous waste sites are located. Areas that have the lowest property values, highest minority population and closest proximity to environmental hazards closely align with the boundaries City Ordinance 223.
While this study identifies and measures spatial environmental inequality between groups in Lubbock, further investigation is required to evaluate what health effects occur in Lubbock’s minority and low-income communities that are attributed to living in close proximity to toxic waste releasing facilities. Though significant spatial inequalities exist in Lubbock, these results do not explicitly reveal causation. While in the present day there is no evidence of direct intent to place facilities in close proximity to minority and low-income areas, there is evidence from historical documents of lag causation in terms of minority community and hazard site co-location. City Ordinance 223 forcibly restricted African Americanresidents in a small area of Lubbock. The 1943 city plan proposed zoning areas within and around these African American neighborhoods for industrial activity and heavy manufacturing. Today, a spatial pattern exists such that the African American and Hispanic communities are still highly concentrated in these areas. There is some debate as to whether industry was used as a buffer between the African American and White neighborhoods,however, there is no debate that these spatial patterns, created almost a century ago, still shape demographics spatial housing patterns in the present day.16
Segregation still existed despite the absence of racial and ethnic discriminate housing laws. Parts of the city planned and zoned for heavy industrial and hazardous waste processing/releasing facilities developed north and east of the city’s CBD act as buffers between Black and Hispanic neighborhoods and the rest of Lubbock. Despite the factthat spatial inequality appears to exist, the level of disadvantage these communities actually experience has yet to be investigated. Such work would provide significant insight into the relationship between spatial environmental inequality and empirical environmental health for Lubbock County.This study assumes spatial coincidence: The presumption that exposure to a point (such as a facility) of pollution is limited to and contained within the closest surrounding geography.9 Only empirical health studies and plume mapping can further evaluate the effects of this spatial phenomenon. If the close proximity to environmental health hazards is associated with health problems, African American, Hispanic and low-income communities in Lubbock would be expected to have higher instances of chemical exposure and documented symptoms similar to the effects of exposure to released chemicals.42.43 It would also be expected that these minority community cases would be higher than those of White andhigh-income communities.
For much of its history, Lubbock has dealt with racial intolerance, racist planning and zoning projectsthat restricted African American residents to a circumscribed area of the city. Racist planning ordinances and practices drove the city to restrict African American and Hispanicresidents; hence continued spatial environmental inequality in Lubbock is a case of lagged causation. The finding of this study shows how a more than 90-year-old ordinance and a more than 70-year-old city plan have predisposed the present-day spatial distributions of this high plains, far west Texas city. The past has fashioned the demographic and environmental landscape currently present in Lubbock County.
References
- Yuan, Q. (2018). Mega freight generators in my backyard: A longitudinal study of environmental justice in warehousing location. Land Use Policy, 76, 130-143.
CrossRef - Cole, L. W. and Foster, S. R. (2001). From the ground up: Environmental racism and the rise of the environmental justice movement. New York: NYU Press.
- Mohai, P. andSaha, R. (2015). Which came first, people or pollution? A review of theory and evidence from longitudinal environmental justice studies. Environmental Research Letters, 10(12), 125011.
CrossRef - Pulido, L. (2015). Geographies of race and ethnicity 1: White supremacy vs white privilege in environmental racism research. Progress in Human Geography, 39(6), 809-817.
CrossRef - Pulido, L. (2017). Geographies of race and ethnicity II: Environmental racism, racial capitalism and state-sanctioned violence. Progress in Human Geography, 41(4), 524-533.
CrossRef - Pulido, L., Sidawi, S., and Vos, R. O. (1996). An archaeology of environmental racism in Los Angeles. Urban Geography, 17(5), 419-439.
CrossRef - Mohai, P., and Bryant, B. (1992). Environmental injustice: weighing race and class as factors in the distribution of environmental hazards. U. Colo. L. Rev., 63, 921.
- Maantay, J. (2007). Asthma and air pollution in the Bronx: Methodological and data considerations in using GIS for environmental justice and health research, Health and Place 13(1), 32-56.
- Chakraborty, J., Maantay, J.A. and Brender, J.D. (2011). Disproportionate Proximity to Environmental Health Hazards: Methods, Models, and Measurement. American Journal of Public Health 101 (S1): S27-S36.
- McConnachie, M. M., and Shackleton, C. M. (2010). Public green space inequality in small towns in South Africa.Habitat International, 34 (2), 244-248.
CrossRef - Finewood, M. H. (2012). Feeling the squeeze: A political ecology of race and amenity-based development in coastal Bluffton, South Carolina. Local Environment17(9), 991-10
CrossRef - Cross, J. A. (2001). Megacities and small towns: different perspectives on hazard vulnerability. Global Environmental Change Part B: Environmental Hazards, 3(2), 63-80.
CrossRef - Whittemore, A. H. (2017). Racial and class bias in zoning: Rezonings involving heavy commercial and industrial land use in Durham (NC), 1945–2014. Journal of the American Planning Association, 83(3), 235-248.
CrossRef - Gelo, D. J. (2000). "Comanche Land and Ever Has Been": A Native Geography of the Nineteenth-Century Comanchería. The Southwestern Historical Quarterly, 103(3), 273-307.
- Prater, N. (05/02/1999). Haunted by History: Deep-rooted disparity doesn’t die. The Avalanche Journal.
- Foster, R.L. 1974. Black Lubbock: A History of Negroes in Lubbock, Texas, To 1940.Master’s Thesis, Texas Tech University Department of History, Lubbock, TX, Texas Tech University.
- Delaney, D. (1998).Race, place, and the law 1836-1948. Austin: University of Texas Press.
- Gallagher, J. (04/25/2006). Council Set to Abolish Racist 1923 Ordinance. Lubbock Avalanche Journal. Retrieved August 6, 2018, from http://www.kcbd.com/story/4818279/council-to-get-rid-of-83-year-old-ordinance-defining-segregation?clienttype=printable.
- Sorrensen, C. L., Carter, P. L., & Phelps, J. (2015). Urban landscape as mirror of ethnicity: trees of the South Plains. Urban Geography, 36(7), 1042-1063.
CrossRef - Hensley, D. (2009). A growing impact: City’s Hispanics have come a long way from when ‘Avenue H was about as far as we could go’. Lubbock Centennial. Retrieved August 6, 2018, from http//www.lubbockcentennial.com/AJremembers/091408.shtml.
- Chavis Jr., B.F. and Lee, C. (1987). Toxic Waste and Race in the United States: A National Report on the Racial and Socio-Economic Characteristics of Communities with Hazardous Waste Sites. United Church of Christ, New York.
- Nelson, J. R., andGrubesic, T. H. (2018). Environmental Justice: A Panoptic Overview Using Scientometrics. Sustainability, 10(4), 10
- Reed, M.G. and George, C. (2011). Where in the world is environmental justice? Progress in Human Geography 35(6), 835-842.
- Eckerd, A., Campbell, H., and Kim, Y. (2012). Helping those like us or harming those unlike us: Illuminating social processes leading to environmental injustice, Environment and Planning B: Planning and Design, 39(5), 945-970.
- Bowen, W.M., Atlas, M., and Lee, S. (2009). Industrial agglomeration and the regional scientific explanation of perceived environmental injustice, Annals of Regional Science, 43 (4): 1013-1031.
- Pulido, L. (1996). A critical review of the methodology of environmental racism research. Antipode, 28(2), 142-159.
CrossRef - Tiefenbacher, J. P. andHagelman III, R. R. (1999). Environmental equity in urban Texas: race, income, and patterns of acute and chronic toxic air releases in metropolitan counties. Urban Geography, 20(6), 516-533.
CrossRef - Boone, C. (2002). An assessment and explanation of environmental inequity in Baltimore. Urban Geography, 23(6), 581-595.
CrossRef - Cavendish, W. (1999). Poverty, inequality and environmental resources: quantitative analysis of rural households. Centre for the Study of African Economies, Institute of Economics and Statistics, University of Oxford.
- Hines, R. (2007). Race, environmental justice, and interest group mobilizations: hazardous waste and the case of Sumter County, Alabama. WesternJournal ofBlackStudies, 31(1), 50.
- Allen, A., Dávila, J. D., and Hofmann, P. (2006). The peri-urban water poor: citizens or consumers? Environment and Urbanization, 18(2), 333-351.
- Cutter, S. L., Holm, D., and Clark, L. (1996). The role of geographic scale in monitoring environmental justice. Risk Analysis, 16(4), 517-526.
CrossRef - Daniels, G., & Friedman, S. (1999). Spatial inequality and the distribution of industrial toxic releases: Evidence from the 1990 TRI. Social science quarterly, 244-262.
- Maantay, J. (2002). Mapping environmental injustices: pitfalls and potential of geographic information systems in assessing environmental health and equity. Environmental health perspectives, 110(Suppl 2), 161.
CrossRef - Giordano, A. and Cheever, L. (2010). Using dasymetric mapping to identify communities at risk from hazardous waste generation in San Antonio, Texas, Urban Geography 31(5), 623-647.
- Wissinger, P. (2005).The Impact of Chemical Hazardous Sites on Residential Values. Doctoral Dissertation, Texas Tech University College of Architecture, Lubbock, TX: Texas Tech University.
- Boone, C.G. and Modarres, A. (1999). Creating a toxic neighborhood in Los Angeles County: A historical examination of environmental inequity. Urban Affairs Review, 35(2), 163-187.
CrossRef - Chun, Y. and Griffith, D.A. (2013). Spatial Statistics &Geostatistics, Thousand Oaks, CA: Sage Publications.
- Darmofal, D. (2015). Spatial Analysis for the Social Sciences. Cambridge: Cambridge University Press.
CrossRef - Anselin, L. (2005). Exploring Spatial Data with GeoDa: A Workbook, Retrieved August 6, 2018, from https://geodacenter.asu.edu/learning/tutorials.
- Ward, M. D. and Gleditsch, K. S. (2018). Spatial regression models (Vol. 155). Thousand Oaks, CA: Sage Publications.
- Maantay, J.A., Tu, J., and Maroko, A.R. (2009). Loose-coupling an air dispersion model and a geographic information system (GIS) for studying air pollution and asthma in the Bronx, New York City, International Journal of Environmental Health Research, 19(1), 59-79.
- Corburn, J. (2004). Confronting the Challenges in Reconnecting Urban Planning and Public Health, American Journal of Public Health, 94(4): 541-546.

This work is licensed under a Creative Commons Attribution 4.0 International License.


