Methodological Issues of Poverty Measurement
Satyendra Nath Chakrabartty *
1Indian Ports Association, Consultant, New Delhi India .
chakrabarttysatyendra3139@gmail.com
http://dx.doi.org/10.12944/CRJSSH.7.2.08
Issues relating to defining poverty as lack of resources like income and wealth to a household or individual to meet the basic needs to maintain a reasonable standard of living in a given society have been addressed along with various approaches to measure poverty. Limitations of Multidimensional Poverty Index (MPI) including aggregation of the chosen indicators have been discussed. The paper suggests multiplicative aggregation of ratios of chosen indicators at current period and the base period to find an index of overall poverty status of a country at the C-th time period over the based period (OPIc0). The index OPIc0 involves no selection of weights, satisfies desirable properties with significantly reduced substitutability among the indicators and producing no bias for advantaged groups. Replacing the base period data by the national targets to remove all forms of poverty, the modified index will indicate how far the country is at the C-th time period from the goals set at national level. The plot of growth/decline of multidimensional poverty in terms of changes in OPIct for a country reflects effectiveness of policy measures adopted and can be used in projection of poverty for the country. The index OPIc0 facilitates to form two sub-indices: (i) New Multidimensional poverty index (INMPI) based on suitable indicators, in line with MPI without any cut-off marks leading to rejection of households/individuals and (ii) Transient poverty index for a period (ITPt ) based on chosen indicators like poverty spell, chronic and transient poverty and associated factors. Using longitudinal data, probability of movement into poverty and out of poverty can be estimated over time (pNP-P and pP-NP) and temporal poverty of a country during the period (t,t_p) can be better understand by P - Escape(t,t_p) and P - Stic.(t,t_p). Estimation of such probabilities along with economic trajectory of a country will help the planners to achieve the national goals.
Copy the following to cite this article:
Chakrabartty S. N. Methodological Issues of Poverty Measurement. Current Research Journal of Social Sciences and Humanities. 2024 7(2).
DOI:http://dx.doi.org/10.12944/CRJSSH.7.2.08Copy the following to cite this URL:
Chakrabartty S. N. Methodological Issues of Poverty Measurement. Current Research Journal of Social Sciences and Humanities. 2024 7(2).Available here:https://bit.ly/41YtPYh
Download article (pdf) Citation Manager Review / Publish History

Introduction
Poverty is usually taken as lack of resources like income and wealth to a household or individual to meet the basic needs to maintain a reasonable standard of living in a given society (Townsend, 1979). In addition to failure to meet basic needs, the concept of poverty also deals with notions of inequality, disadvantage, deprivation, capability, inadequacy, etc. Political philosophy focusing on “ideal world’ with no poverty also talks of prevalence of injustices in reality (Sen, 2009; Hamlin and Stemplowska, 2012). However, concepts of income and wealth are different. While wealth is a stock concept where inequality involves values of tangible assets, income is a flow concept where income inequality considers incomes from wages, rent and profit.
The ‘currency of justice’ approach emphasizing equality of resources and welfare by Sen (1980) and Dworkin (1981a, 1981b) has not been favoured since equality is basically relations among people and not distribution of goods (Anderson, 1999; Scheffler, 2003). Researches debated between resource-based and welfare based justice and even suggested hybrid of resources and welfare called “advantage” (Cohen, 1989). Capability deprivation approach by Sen (1999); Nussbaum (2000) suggests on what people are able to ‘do or be’ which is more important than what they possess. Measurement of poverty by capability approach shifting from income or resources to what one can do is extremely difficult. Wolf et al. (2014) suggested retention of traditional concept of poverty, for practical reasons.
Definition of Poverty
Definition of poverty as non-availability of financial resources to meet a set of basic needs is in fact, a nominal definition i.e. to define “Poverty”, equivalent clauses or features are assigned. It is not an operational definition and gives rise to questions like:
What is the set of basic needs?
Is it static or changes with time?
Is it same across all regions and culture?
Regarding (i), a person needs food, water, air and shelter to survive. However, the set of basic human needs may also cover physical, emotional, mental, relational, self and spiritual needs. Income is perceived as a means to improve human welfare, and lack of income is taken as the major contributor of poverty (Keeley, 2015). But income is not the sole measure of poverty. Illustrative variables which can influence individual capability are lack of: personal resources like health, talents, skills; external resources like income and wealth; and social structures including legal, cultural and environmental factors. Thus, poverty in terms of lack of income and wealth is just one of the many factors that determine poverty of an individual or a household. Thus, poverty is multidimensional.
The set of basic needs is perceived vaguely and is never exhaustive. In addition, the set varies with time. For example, poverty goes beyond deprivations of food, shelter to lack of access to education, medical facilities, social exclusions, etc. and schemes to mitigate such deprivations may require access to internet, bank account, etc. Education and health not only influence the freedom to live better but are important for effective participation in economic and political activities (Sen, 1999). Thus, the set of basic needs is not static and changes with time.
Poverty is an economic and a social problem too. Poor people often become socially isolated and feel helpless and marginalized. Their focus is primarily on the present, with little consideration for the future. In short, culture of poverty is both an adaptation and a response to the marginalization of the poor. Among the people who are in long state/condition of poverty, Haq (2019) found that some cultural traits promote vulnerability and poverty and such traits are passed on from one generation to the next. Regional differences in multidimensional poverty are statistically challenged.
Literature survey
In the backdrop of divergent issues relating to poverty and its measurement, two important questions are:
Who are poor?
Index of poverty to reflect how poor the poor are?.
Identification of the poor involves setting a poverty line reflecting minimum income required to meet the basic needs and finding the number of people below the poverty line (BPL) who are considered poor or under absolute poverty. The other concept is relative poverty which is evaluated in comparison to others in the country, say a relative poor person earns <60% of median income of the country. Thus, there will always be a substantial number of individuals who are relatively poor in each country. Accordingly, measurements of poverty emphasize absolute poverty and not relative poverty.
The poverty line first decides the minimum level of requirement of food, shelter, clothing, fuel, light, footwear, educational and medical needs, etc. which are multiplied by the corresponding prices. Thus, identification of the poor involves a survey to find sample proportion of poor (BPLs) and estimating population proportion by inductive logic. Quality of estimates clearly depends on measurable definition of poor, quality of sample and estimation procedure. For example, different estimates of poverty in India by India Human Development Survey (IHDS) data and Household Consumption Expenditure Survey by National Sample Survey Office (NSS) data could be due to differences in the number of items and design characteristics (Desai et al. 2024). However, the poverty line in terms of income may vary across countries and time. The international poverty line suggested by the World Bank (2021) as income of $1.90 per day, was revised to $2.15 per person per day by the World Bank (2022). The sustainable development goal (SDG-1) aiming at elimination of all forms of poverty considers daily income $1.25 at 2017 PPP (Purchasing Power Parity) as poverty line(UN DESA 2023). In India, inflation-adjusted poverty lines separately for urban and rural areas are used.
Poverty line based on consumption serves two purposes, normative and monitoring. While normative standards reflect a social contract about the basic standard of living that should be made available to all individuals while monitoring standards track lifestyle changes over time (Srinivasan, 2007). Following this monitoring approach, one can focus on understanding the poverty dynamics at the household level, using panel data.
Index of poverty
Index of poverty based on multidimensional approach addresses both the identification of poor and intensity of poverty. Avoiding single income based poverty line, Multidimensional poverty first decides values of each of the chosen k-dimension of poverty like poor health, poor quality of work, lack of clean water or electricity, schooling, etc. by a vector PL = (Z01, Z03, Z03, …….Z0k)T
Multidimensional poverty requires appropriate aggregation of the chosen indicators to capture the proportion of the poor and measures of incidence of poverty among the identified poor involving deprivation scores on non-monetary indicators under selected dimensions. Index based on such multi-dimensional deprivations is called multidimensional poverty index (MPI). Clearly, MPI aiming at areas beyond the monetary metrics is popular at international level (Suppa, 2023). Country wise MPI data is published by the United Nations Development Programme jointly with the Oxford Poverty and Human Development Initiative (UNDP-OPHI 2021). However, the factors influencing differences in non-monetary and monetary poverty differ since different countries have different set of policies to support welfare, like social assistance, social insurance. labour market interventions, etc. (Yusuf et al. 2024). Accordingly, several countries developed their own multidimensional poverty measures at the national level primarily because national poverty statistics being used to guide national policies cannot be meaningfully compared across countries. For example, India launched National MPI considering the indicators of the global MPI plus additional indicators like maternal health and bank account under the dimensions of health and standard of living, respectively.
The global MPI is based on the proportion of people in a population who are multidimensionally poor, denoted by H (head count ratio) and also average number of deprivations of the poor, denoted by A and MPI of a country at a given year is computed as MPI = H *A. MPI counts the number of weighted items that households lack and take sum with equal weights to the dimensions and different weights to the indicators within a dimension. Deprivation score of a household is taken as “1” if deprived and “0” if not. The proportion of multidimensional poor (weighted by household size) gives value of H. Non-monetary dimensions, indicators and weights of MPI are shown in Table 1.
Table 1: Non-monetary Dimensions, indicators and weights of MPI
Dimension (each given weight of | Indicators and weights |
Health | Any undernourished person <70 years of age [1/6] |
Death of a child <18 years during the previous five-year period [1/6 | |
Education | Non completion of six years of schooling [1/6 |
A school-aged child is not attending school [1/6 | |
Access to basic infrastructure | Lacks access to limited-standard drinking water [1/18] |
Lacks access to limited-standard sanitation [1/18] | |
Use of solid fuel like dung, agricultural crop, shrubs, wood, charcoal, or coal for cooking [1/18] | |
Lacks access to electricity [1/18] | |
Inadequate housing materials either in floor/roof/walls [1/18] | |
At most one possession of assets: radio, TV, telephone, computer, refrigerator, animal cart, bicycle, motorbike, and not owning a car or truck [1/18] |
Methodology of MPI
MPI considers three equally weighted (1/3) dimensions, namely, Health with two indicators each with weight (1/6 , Education (two indicators, each with weight 1/6), and Access to basic infrastructure with six indicators, each with weight 1/18. The Deprivation score of an individual or a household identified as poor is the count of items that the household lacks where score of “1” is given if deprived and “0” if not. Sum of such scores is computed with equal weights to the dimensions and different weights to the indicators within a dimension. If the deprivation score of a household is more than 33%, then the household is considered as multidimensionally poor. The proportion of multidimensional poor (weighted by household size) gives the head count ratio or the proportion of poor in the country. Thus, MPI follows neither Intersection approach nor the Union approach.
Major limitations of MPI
Major limitations of MPI are
No reasons to support that all the three dimensions contribute equally to poverty across countries, and people within a country (Ravallion, 2011). Equal weights of the three dimensions of MPI is not statistically justified (Pasha, 2017)
Does not cover food insecurity, a direct consequence of poverty.
Health related indicators like death rate; maternal mortality, access to hospitals, health insurance, etc. are absent.
A household with no children gets zero deprivation scores in Education dimension and in one indicator of Health dimension.
Intra-household inequality or inequality among the poor is ignored
The assumption of no correlation among the items or dimensions of MPI is not realistic (Nicole 2011). For example, safe drinking water may be positively related to indicators of health and education.
MPI does not reflect distribution of deprivations among the poor. Hence, policies based on MPI may fail to give attention required to the neediest of the needy.
MPI based on cross-sectional data does not reflect the poverty dynamics i.e. movement into and out of poverty (intertemporal poverty) and the factors influencing such transitions. For developing countries like India, such intertemporal poverty are common despite persistence of poverty across time (Sahasranaman, 2021).
The cut-off mark of deprivation score > 33% is arbitrary. Any change in the cut-off mark will affect the results on poverty rates, country rankings, etc. Households lacking say 8 out of 10 indicators are not distinguished from households lacking 4 out 10. Moreover, a household lacking only in 5-indicators of “Access to basic infrastructure” is not considered as poor since 5 × 1/18 = 0.277< 33%. Data dominated by the poor who are closest to the cut-off score, poverty can be reduced fast. Mishra (2024) observed information loss in computation of MPI due to cut-offs between and within dimensions and also converting data to binary form and suggested need of re-thinking of social welfare measures linked to poverty line for a broad-based approach Mishra (2024 b).
Change in MPI due to 1% decrease in H=change in MPI due to 1 % decrease in A. For example, consider for a country at given year H= 14.96%, A= 44.39% and MPI=H*A = 0.066. Here, 1% decrease in H and unchanged value of A means improved MPI = 0.06196. Similarly, 1% decrease in A, with unchanged value of H implies new value of MPI = 0.06491. In this example, elasticity of MPI with respect to H and A are different and change in MPI is more dependent on change in H.
Methodology of MPI as a composite index (CI) may be criticized for compensatory approach i.e. high deprivation in one indicator can be compensated by low deprivations in other indicators. Aggregation of indicators by geometric mean minimizes the substitution effect. The Human Development Index (HDI) now uses geometric mean for aggregation (UNDP 2010), Human Poverty Index for developing countries (HPI-1) uses cube root of average of figures in percentage (UNDP, 2007).
The weighting system in MPI has been questioned. Different approaches were made to select weights and each choice has implications on the CI. Ravallion (2011) suggested for public debate about selection of weights. For OPHI’s MPI, Deyshappriya and Feeny (2021) found dimension weights using Discrete Choice Experiment and arranged the dimensions based on their importance as Health (0.38), Education(0.33) and Living standards(weight 0.29). But findings based on order effects are at variance. Kumara (2013) used weights resulting from Principal Component Analysis (PCA) where each of the first six eigenvalues exceeded unity implying six independent dimensions of poverty, which is a shift from the MPI. Data driven PCA weights vary over time and space. Multiple Correspondence Analysis was undertaken by Pasha, (2017) to find weights of the indicators which were different for different countries since pattern of deprivations vary across regions.
Copula based weights considering dependence between the dimensions were used by Tkach & Gigliarano (2020) where such copula based weights were multiplied with the normalized scale values of deprivation scores to find the weighted sum. Association between dimensions of poverty using copula based multivariate generalizations of Spearman’s rho is not unanimous. Effectiveness of copulas may be compromised by challenges related to scalability and handling mixed-type data in practical applications. Ranks of countries were sensitive to weighting schemes of MPI (Pasha, 2017). Alkire & Santos (2014) and Santos & Villatoro (2018) examined sensitivity of weights of MPI rankings.
Different weighting methods have their own advantages and disadvantages. The most suitable method to assign weights in multidimensional poverty analysis is difficult to identify (Kumara, 2013). Any weighting system can be criticized (Greco, et al.2019). Need is felt to develop MPI avoiding weights to the indicators/dimensions.
The paper suggests multiplicative aggregation of chosen indicators to find an index of overall poverty status of a country at a given time (OPIc0) avoiding scaling and selection of weights, facilitating better comparisons, assessing changes across time, plotting of growth/decline of poverty curve, computation of the index for each dimension, finding relative importance of the dimensions and undertaking statistical tests.
Poverty dynamics
Duration of poverty (poverty spell) and movements to and from poverty are the major areas of poverty dynamics (Addison et al., 2009). Poverty transition matrix (PTM) by Madan (2022); Guo et al. (2022) and stickiness probability of multidimensional poverty by Apablaza and Yalonetzky, 2012; Alkire et al., 2017) ignore cumulative effect of poverty spell on poverty dynamics.
PTM showing probabilities of transitions from poverty or non-poverty (P -NP)and vice versa (NP - P) or remaining to poverty (P - P) or non-poverty (NP - NP)during time period t to (t + 1) may be presented by 2×2 matrix as follows:
![]()
pNP-P and pP-NP are probability of transition into and out of poverty in a year and help to understand the evolution of poverty transitions.
Wang et al. (2023) obtained estimates of elements of PTM by Kaplan–Meier method followed by discrete-time proportional hazards model, to investigate dynamics of multidimensional poverty and its factors. While survival function S(t) gives the probability of survival of an individual exceeding a specified time t, hazard function h(t) gives the probability that an individual at t-th time has an event at that time. Thus, h(t) is related to the incidents/event rate, and S(t) reflects the cumulative occurrence or non-occurrence. Kaplan-Meier survival curve (a step function) is popular to analyze ‘time-to-event’ data but has several limitations and cannot assess the relationship of survival with the explanatory variables.
Chakrabartty (2021) proposed Geometric Mean approach for survival analysis for better assessment of disease intensity in terms of the chosen measurable factors/variables, identification of bad prognosis factors and quantification of progress/deterioration of a patient over time (analogous to hazard function of an individual).
Denoting Poverty line by PL and Below poverty line by BPL, quick estimates of pP-NP and pNP-P given by Sahasranaman, (2021) are:
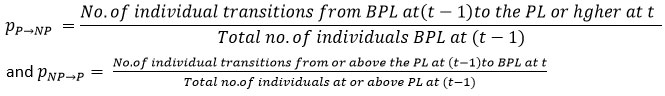
The author also derived (i) probability of escaping poverty (P - Escape (t,t,p)) by an individual who has been poor for >tp periods and is non-poor at t and (ii) stickiness probability (P - Stic.(t,t,p) ) for an individual who has been poor for >tp periods and still is in poverty at t-th period. Impact of economic trajectory of a country over a period ( tp,t) can be better understood by P - Escape(t,t,p) and P - Stic.(t,t,p) .
Vulnerable group may be defined as those whose monthly per-capita consumption is > PL but < 2PL (Desai et al. 2024). However, choice of 2PL is arbitrary. Better is to consider escaping poverty and stickiness probability. However, estimates of such probabilities are sensitive to short term fluctuations in economic conditions and migration opportunities.
Materials and Methods
Indicators
Let X1c denote the proportion of poor below the poverty line defined by the country at the current period and X10 be the corresponding figure for the country for the base period. Let X2, X3, ……Xk are the (k-1) indicators chosen to assess poverty under various non-monetary dimensions with count data, and Xk+1, Xk+2,, ….., Xn-k represent other indicators in ordinal or interval scales relating to economic, social, environmental and psychological dimensions like uncensored poverty spell, indicators/variables influencing chronic and transient poverty like household size, years of schooling, achievement in education, accumulation of wealth/assets, living standards, social relations, conditions of employment, status of health and well-being, increases in the child dependents, inactive adults, etc. (Acar et al., 2014) including number of individuals moved out or moved into the poverty at the given period. For each such indicator ensures that its ratio of current value and base period value are positively related to poverty.
Aggregation
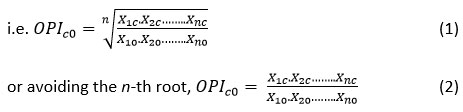
Avoiding selection of weights, scaling/normalization, distributions and inter-correlations of the chosen indicators, the index of overall poverty status of a country at a given time (OPIc0) is proposed to be defined as geometric mean of the ratios
![]()
0 where the vector Xc = (X1c, X2c, ……, Xnc)T are scores of n-indicators in the current period and scores of the corresponding base period vector is X0 = (X10, X20, ……, Xn0)T
OPIc0 is a poverty metric based on monetary and non-monetary indicators such that lower value of OPIc0 indicates improvement based on all the chosen indicators.
Properties of OPIc0
OPIc0< 1 => Overall improvsement of poverty of the country from the base year. Similarly, i-th indicator, Xic/Xi0 < 1 imply improvement in the current period over the base period.
Progress or improvement in period t over (t-1)-th period by the of the i-th country may be
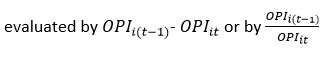
The proposed index as per equation (2) is monotonic, 1% gain in Xic/Xi0 implies 1% gain in OPIc0. A percentage change from the base period is reflected by 100*OPIc0.
OPIc0 by (2) is simple to calculate, invariant under change of scale, can consider all indicators including those given in percentages or in ordinal scale or skewed. OPIc0 reduces greatly substitutability among the indicators and is not affected much by outliers, shows no bias either for developed or under-developed countries and enables repetitions of experiment under similar conditions (Herrero, et al. 2010). The index can be computed separately for each dimension considering the indicators chosen under the dimension. The index can be computed separately for the regions and also for properly defined sub-groups say rural or urban groups, socio-economically backward groups, educated or uneducated groups, etc.
Results
The index facilitates:
Identification of critical indicator for which

and merits attention for initiation of necessary corrective policy action.
Similarly, critical dimension(s) can be identified
Finding relative importance of j-th indicator

Satisfies time-reversal test since OPIc0* OPI0c = 1
Enables formation of chain indices since OPI20 = OPI21 × OPI10
Enables drawing of graph of a country to reflect path of improvement or decline along with focused investigations on the points of fluctuations. Such path may also help interregional comparisons over time with respect to OPIt.
Replacing base period data by data for the previous year, the index can be computed on Year-to-Year basis (OPIt,(t+1))
Replacing the base period data by the national targets to remove all forms of poverty, OPIc0 will indicate distance of a country from the national goals at the C-th time period.
Mean and variance of OPIc0 for a group of regions can be computed in terms of logarithm of the components, since log?(GM) approaches lognormal distribution (Alf et al., 1979).
Limitations of the proposed method
If a new indicator is introduced at a later period, estimation of its values are required in the base year and subsequent years.
Missing data are not considered. Treating missing data is beyond the scope of the present paper.
Different base period figures (reference points) of countries do not help in meaningful comparison of countries in terms of OPIc0
The method fails if a particular indicator or target attains zero or negative value.
Discussion
The paper proposes multiplicative aggregation of ratios of the chosen indicators to find an index of overall poverty of a country at a given time (OPIt) avoiding the problems of scaling and weights, facilitating better comparisons, assessing changes across time, plotting of growth/decline of poverty curve, computation of the index for each dimension, finding relative importance of the dimensions and undertaking statistical tests. The index is preferred as it satisfies many desirable properties including reduction of substitutability among the indicators, linearity between gain in ratio of an indicator and gain in OPIt, time-reversal test, formation of chain indices, etc.
Replacing the base period data by the national targets to remove all forms of poverty, the index OPIc0 will indicate how far the country is at the C-th time period from the goals set at national level. Identification of critical indicator (s) may help the policy makers to initiate necessary corrective policy action. The plotting of growth/decline of multidimensional poverty in terms of changes in OPIct for a country reflects effectiveness of policy measures adopted and can be used in projection of poverty for the country.
The index OPIc0 can be broken down to sub-indices like:
New Multidimensional poverty index (INMPI) considering the first k-indicators. This is in line with MPI with the additional benefit of no selection of weights and no cut-off marks leading to rejection of households or individuals.
Index of transient poverty or time-dimension of poverty at t-th period (ITPt) considering the indicators Xk+1, Xk+2, ….., Xn-k relating to the factors influencing poverty spell, chronic and transient poverty, which could be in ordinal or interval scales. Using longitudinal data, assessment and monitoring of the extent of chronic or persistent poverty within society can be made in terms of probability of transitions to and from poverty (pNP?P and PP?NP) and economic trajectory of a country over a period by P - Escape(t, t_p) and P - Stic.(t, t_p).
Empirical relationship may be found between INMPIt and ITPt and also of OPIt0 on INMPIt and ITPt by regression analysis for a particular country across time.
Conclusion
The proposed index OPIc0 satisfying desirable properties facilitates computation of New Multidimensional poverty index (INMPI) which is in line with MPI with the additional benefits and Index of transient poverty (ITPt) covering the factors influencing poverty spell, chronic and transient poverty, which could be in ordinal or interval scales. Estimation of probability of persistent poverty within society and probability of transitions to and from poverty along with economic trajectory of a country will help the planners to achieve the national goals. However, gender perspective and old age perspective need to be integrated with measures of poverty. Future studies may be undertaken to investigate robustness of the proposed index along with its relationships with the New Multidimensional poverty index (INMPI) and the Index of transient poverty (ITP)
Acknowledgement
The author thanks their home university for its ongoing support for their research.
Funding Sources
The author received no financial support for the research, authorship, and/or publication of this article.
Conflict of Interest
The author(s) do not have any conflict of interest.
Data Availability Statement
This statement does not apply to this article
Ethics Statement
This research did not involve human participants, animal subjects, or any material that requires ethical approval
Informed Consent Statement
This study did not involve human participants, and therefore, informed consent was not required
Author Contributions
The sole author was responsible for the conceptualization, methodology, data collection, analysis, writing, and final approval of the manuscript.
References
- Acar, A. and Baslevent, C. (2014). Examination of the Transitions of Households into and out of Poverty in Turkey. BETAM Working Paper Series No. 015.
- Addison T, Hulme D, Kanbur R, et al. (ed.) (2009) Poverty dynamics: measurement and understanding from an interdisciplinary perspective. In: Poverty dynamics: interdisciplinary perspectives. Oxford University Press, Oxford. 03–26
CrossRef - Alf, E.F. and Grossberg, J.M. (1979): The geometric mean: Confidence limits and significance tests, Perception &Psychophysics, 26 (5), 419-421
CrossRef - Alkire S, Apablaza M, Chakravarty S, and Yalonetzky G (2017). Measuring chronic multidimensional poverty. J Policy Model 39: 983–1006. Doi: 10.1016/j.jpolmod.2017.05.020
CrossRef - Alkire S and Foster JE (2011). Counting and Multidimensional Poverty Measurement, Journal of Public Economics, 95, 476 – 487
CrossRef - Alkire S and Santos ME (2014). Measuring acute poverty in the developing world: Robustness and scope of the multidimensional poverty index. World Development, 59, 251–274.
CrossRef - Anderson, Elizabeth (1999). What is the Point of Equality? Ethics, 109(2), 287–337
CrossRef - Apablaza, M. and Yalonetzky, G. (2012). Chronic multidimensional poverty or multidimensional chronic deprivation. Oxford Poverty & Human Development Initiative (OPHI). Research Paper, No. 34a. Retrieved from:https://ora.ox.ac.uk/objects/ uuid:33e92277-f78d-4bc8-8e66-d657810c80c4
- Bossert, W., Chakravarty, S. R. and D'Ambrosio, C. (2012). Multidimensional Poverty and Material Deprivation with Discrete Data. https://doi.org/10.1111/j.1475-4991.2012.00519.x
CrossRef - Chakrabartty, Satyendra Nath (2021). Survival Analysis: Alternate approach. International Journal of Pharmaceutical and Bio-Medical Science, Vol.1 (6), 72 – 78. https://doi.org/10.47191/ijpbms/v1-i6-01
- Cohen, G.A. (1989). On the Currency of Egalitarian Justice. Ethics, 99(4), 906–944
CrossRef - Desai Sonalde, Barik D, Choudhuri P, Chouhan B, Sharma OP and Tiwari DK. (2024). Rethinking Social Safety Nets in a Changing Society. Presented in the India Policy Forum, NCAER, New Delhi, July 2–3, 2024
- Deyshappriya, N.P.R. and Feeny, S. (2021).Weighting the dimensions of the multidimensional poverty index: findings from Sri Lanka, Soc. Indicat. Res. 156 (2021) 1–19.
CrossRef - Dworkin, Ronald (1981a). What is Equality? Part 1: Equality of Welfare. Philosophy & Public Affairs, 10(2), 228–240
- Dworkin, Ronald (1981b). What is Equality? Part 2: Equality of Resources. Philosophy & Public Affairs, 10(3), 283–345
- Greco S, Ishizaka A, Tasiou M and Torrisi G (2019): On the Methodological Framework of Composite Indices: A Review of the Issues of Weighting, Aggregation, and Robustness, Soc Indic Res141:61–94. https://doi.org/10.1007/s11205-017-1832-9
CrossRef - Guo J, Qu S, and Zhu T (2022). Estimating China’s relative and multidimensional Poverty: Evidence from micro-level data of 6145 rural households. World Dev Perspect 26:100402. https://doi.org/10.1016/j.wdp.2022.100402
CrossRef - Hamlin, Alan and Stemplowska, Zofia (2012). Theory, Ideal Theory and Theory of Ideals. Political Studies Review, 10(1), 48–62
CrossRef - Haq, E. (2019). Cultural Construction of Poverty in India. Indian Anthropologist, 49(2), 23–40. https://www.jstor.org/stable/26954857
- Herrero C, Martinez R & Villar A. (2010). Multidimensional social evaluation. An application to the measurement of human development. Review of Income and Wealth, 56, 483–497.
CrossRef - Keeley, B. (2015). Income Inequality: The Gap between Rich and Poor, OECD Insights (OECD, 2015). https://doi.org/10.1787/ 9789264246010-en
CrossRef - Kumara, P (2013). Analysing Multidimensional Poverty in Sri Lanka: A New Measuring Approach. [Workshop Material]. Kobe, Japan: Kobe University
- Mishra, S (2024): Multidimensional Index: A Note, Working Paper No WP-2024-007, Indira Gandhi Institute of Development Research, Mumbai.
- Mishra, S (2024b): Methodological Nuances in Estimating Proportion and Number of Poor for States and India, 2022-23. Working Paper No WP-2024-010, Indira Gandhi Institute of Development Research, Mumbai.
- Nicole, Rippon (2011). A response to the weaknesses of the multidimensional poverty index (MPI): the correlation sensitive poverty index (CSPI). Briefing Paper 19/2011, German Development Institute
- Nussbaum, Martha (2000). Women and Human Development. Cambridge: Cambridge University Press
- Pasha, A. (2017). Regional perspectives on the multidimensional poverty index. World Development, 94, 268–285.
CrossRef - Ravallion, M. (2011). Mashup indices of development. The World Bank Research Observer, 27, 1–32.
CrossRef - Sahasranaman, A. (2021). Long-term dynamics of poverty transitions in India. Asian Development Review, Vol. 38, No. 2, 213–235. DOI: 10.1142/S0116110521500049
CrossRef - Santos ME & Villatoro P (2018). A multidimensional poverty index for Latin America. Review of Income and Wealth, 64, 52–82
CrossRef - Scheffler, Samuel (2003). What Is Egalitarianism? Philosophy & Public Affairs, 31(1), 5–39
CrossRef - Sen, Amartya (2009). The Idea of Justice. Cambridge MA: Harvard University Press
- Sen, Amartya (1999). Development as Freedom. Oxford: Clarendon Press
- Sen, Amartya (1980). Equality of What? S. McMurrin (ed), Tanner Lectures on Human Values. Cambridge: Cambridge University Press, 195–220
- Srinivasan, T.N. (2007). Poverty Lines in India: Reflections after the Patna Conference. Economic and Political Weekly, 42(41), 4155-4165.http://www.jstor.org/stable/40276550
- Suppa, Nicolai (2023). Mpitb: A toolbox for multidimensional poverty indices. The Stata Journal, 23 (3), 23, 625–657. DOI: 10.1177/1536867X231195286
CrossRef - Tkach K & Gigliarano C (2020). Multidimensional poverty index with dependence-based weights. Social Indicators Research, 161(2), 843-872. DOI: 10.1007/s1120 5-020-02412 –w
CrossRef - Townsend, P. (1979). Poverty in the United Kingdom, London, Allen Lane and Penguin Books UN DESA (2023). The Sustainable Development Goals Report 2023: Special Edition - New York, USA: UN DESA. © UN DESA. https://unstats.un.org/sdgs/ report/2023/
CrossRef - UN DESA (2023). The Sustainable Development Goals Report 2023: Special Edition - New York, USA: UN DESA. © UN DESA. https://unstats.un.org/sdgs/report/2023/
- UNDP (2010): Human Development Report 2010: The Real Wealth of Nations—Pathways to Human Development. New York: Palgrave Macmillan. http://hdr.undp.org/en/content/human-development-report-2010
- UNDP (2007): Human development report 2007/2008 -Fighting Climate Change: Human Solidarity in a Divided World. New York: Palgrave Macmillan.https://hdr.undp.org/sites/default/files/reports/268/ hdr_20072008_en_complete.pdf
- UNDP-OPHI (2021). Global Multidimensional Poverty Index 2021: Unmasking disparities by Ethnicity, Caste and Gender. Special publication, United Nations Development Programme (UNDP) and Oxford Poverty and Human Development Initiative (OPHI). https: //ophi.org.uk / wp-content / uploads / UNDP_OPHI_GMPI_2021_Report_ Unmasking.pdf.
- Wang Q, Shu L & Lu X. (2023). Dynamics of multidimensional poverty and its determinants among the middle-aged and older adults in China. Humanities and Social Sciences Communication, 10, 116.https://doi.org/10.1057/s41599-023-01601-5
CrossRef - Wolf, Jonathan; Lamb, Edward and Zur-Szpiro, Eliana (2014). A Philosophical Review of Poverty. Joseph Rowntree Foundation. United Kingdom.www.jrf.org.uk
- World Bank (2022). Poverty and Shared Prosperity 2022: Correcting Course. Washington, DC: World Bank. doi:10.1596/978-1-4648-1893-6
CrossRef - World Bank (2021). Global Economic Prospects, 198 (2021).https://doi.org/10.1596/978-1-4648-1665-9
CrossRef - Yusuf, A.A., Anna, Z., Komarulzaman, A. & Sumner, A. (2024). Will the poverty-related UN Sustainable Development Goals be met? New projections. Global Policy, 1–15. doi.org/10.1111/1758-5899.13415
CrossRef

This work is licensed under a Creative Commons Attribution 4.0 International License.


