
Resuscitation from Crisis: The Indian Drain and Britain’s Recovery during the Great Depression
Vibha Iyer *
1Department of Economics, Zakir Husain Delhi College, University of Delhi, Delhi India .
Existing mainstream economic history writing on the inter-war period, while writing about Britain’s relatively earlier recovery from the Great Depression in comparison to its capitalist counterparts, have attributed it to its conducive international trade and domestic conditions and therefore as a completely unaided and autonomous process. We argue that the mainstream narrative, which completely omits the role of colonial transfers is ridden with factual and logical inconsistencies and therefore is an incomplete explanation. By drawing from the original framework of the early nationalists’ Drain Theory, we estimate the extent of tax-financed transfers from India to Britain during the inter-war years and argue that it was on the back of these transfers that Britain managed to stay afloat and even stage an earlier recovery from the Great Depression. These findings therefore establish the cruciality of the Drain from India in stabilizing the British economy in a period of crisis in capitalism and provide insight into understanding the evolution of global capitalism itself.
Copy the following to cite this article:
Iyer V. Resuscitation from Crisis: The Indian Drain and Britain’s Recovery during the Great Depression. Current Research Journal of Social Sciences and Humanities. 2026 9(2).
Copy the following to cite this URL:
Iyer V. Resuscitation from Crisis: The Indian Drain and Britain’s Recovery during the Great Depression. Current Research Journal of Social Sciences and Humanities. 2026 9(2). Available here: https://bit.ly/3TgguZz
Citation Manager Review / Publish History

Introduction
Existing studies in mainstream economic history attribute Britain’s industrial revolution and its rise to world leadership in industry and finance in the 19th century as an autonomous process completely devoid of any role of colonial transfers. The same narrative is extended to explain Britain’s early recovery as well in the aftermath of the Depression in the 1930s when compared to its capitalist counterparts.The ‘revisionist’ mainstream view put forward by Richardson (1972), MacDougall (1938) and Arndt (2013) attributes Britain’s recovery to a ‘fortuitous’ combination of circumstances originating in its domestic and external sectors. They argue that while on the domestic front, the recession remained mainly confined to its export sector leaving potential for revival in other domestic sectors, on the external front, its recovery was aided by a favourable terms of trade owing to cheaper imports of primary goods due to the worldwide agricultural recession.Other mainstream scholars like Moggridge (1972) also highlight ‘autonomous impulses’ in Britain’s domestic sectors unaffected by export markets which helped trigger its early recovery from the Depression.
This mainstream narrative falls short of economic logic and facts, when we incorporate the key role of colonial transfers in explaining not only Britain’s rise but also its decline and its subsequent earlier recovery from the Depression of 1929. Our paper explains the detailed process and components of the Drain from India and employs its estimates to assert its key role in reviving Britain’s economy during the Depression. We argue that while the continuing flow of tax-financed transfers from India to Britain may not have been sufficient to enable the latter’s resurrection from the Depression to its former industrial and financial glory, these transfers played the key role in staging an early recovery and staying afloat.In doing so, we attempt to understand the evolution of global capitalism and in particular crisis in capitalism.
Materials and Methods
The Drain as key determinant in Britain’s industrial and financial prowess
We use the Drain Theory as our methodological framework in order to proceed with our argument. Comprehending the basis of the Drain and its precise mechanism is germane to understanding the method of its estimation and the foundational significance of these transfers in the origins of industrial capitalism and its global diffusion. While mainstream economic history completely omits the role of colonial transfers in explaining the origins of industrial capitalism in Britain, heterodox researchers have laid out in detail the significance of colonialism and the surpluses extracted in different forms such as slave rent, land rent and/or tax-financed transfers.In order to understand the detailed process of surplus transfers from India, we refer to the writings of Dadabhai Naoroji, R.C Dutt and Utsa Patnaik, and for our estimates of transfers in this paper we use the archivedhistorical trade data provided digitally by the United Nations Statistics Division. Further we also use other secondary sources, including reports on world trade to substantiate and justify our method as well as estimate of the transfers.
The earliest exposition of the process of effecting colonial transfers was given by the Drain Theory put forward in the late nineteenth and early twentieth century by Dadabhai Naoroji (1901) and R.C Dutt (1902). After the acquisition of Dewani or taxation rights by the East India Company over the provinces of Bengal, Bihar and Orissa in 1765 via the Treat of Buxar, the Drain theorists asserted that a significant portion of this revenue was diverted to finance Britain’s home expenditure. This diversion of locally raised revenue to finance Britain’s expenditureconstituted a drain of India’s resources and this drain via tax-financed transfers which, as asserted by Naoroji and Dutt was unique to British colonialism and marked its distinction from all previous regimes in India.
The early Indian nationalists also laid out the framework by which the drain was effected. In the initial phase, from 1765 until the 1830s, one-third of the domestically raised tax revenue in the Indian colony was set aside by the Company to pay for imports from India,thereby rendering Indian imports to Britain unrequited or free. A substantial portion of these imports was then re-exported to other sovereign countries for Britain to settle its trade deficits with them. This transparent system of effecting the transfers halted with the Charter Acts of 1813 and 1833 ending the East India Company’s trade monopoly. With India now performing the role of a captive market for Britain’s manufactures, the former’s trade surplus with the latter turned to a deficit and the previous mechanism of transfers was no longer possible. India did however continue to post rising trade surpluses with the rest of the world far in excess of its trade deficit with Britain, which proved to be useful for a new mechanism of effecting the transfers. Initially, the problem was resolved via a triangular trade with China, where the latter was militarily subjugated and forced to import Indian produced opium in exchange for tea, silk and other products.
After the British Crown took over the Indian administration in 1858, Council Bills were introduced in 1861 to formalise a circuitous mechanism of effecting the transfers. Importers of Indian goods now had to pay the import value in gold or foreign exchange to the Secretary of State in London and received a Council Bill of the equivalent value. This Council Bill was encashable only in rupees and was handed over to the Indian exporter who was then reimbursed the stated value out of the Indian budget which had a separate component titled ‘Expenditure Abroad’. For accounting purposes, India’s merchandise surpluses earned from world trade were credited to the Secretary of State’s account and these were debited by imposing an equivalent or higher amount of compulsory administered service charges in sterling on India’s current account. The same charges were also listed under the Expenditure Abroad component of India’s budget. Thus, the Council Bills offered a way to convert the locally raised tax revenue in rupees to sterling and simultaneously drain away India’s export surpluses. Indian producers continued to be paid out of their own tax revenue and the convoluted mechanism of Council Bills only obfuscated, yet retained the original process of the Drain via tax-financed transfers (Patnaik 1984).
It is important to note here that the administered service charges which were imposed upon India were entirely political in nature and not seen in the case of any sovereign country. Moreover, the merchandise export surpluses that India earned served only as the lower and not the upper limit for the imposition of these administered invisibles upon India which were “adjusted in an asymmetric manner” (Patnaik 2017) to ensure the transfer. Any surge in export earnings were drained away through imposition of additional arbitrary charges and if in a particular year, the earnings dipped, recourse was sought in borrowing and this led to the steady piling of debt on India’s account.
Such a linking of a country’s external account with its internal budget was unique to India and solely due to its colonial status and not seen in the case of any sovereign country’s economy. This framework of effecting the transfers was laid out by Naoroji and Dutt to provide preliminary estimates of the Drain. Researchers in independent India have built upon this framework and provided a clearer understanding and accurate estimates of the transfers (Habib, S 1976, Patnaik 2006). Patnaik (1984) explains in detail the precise mechanism of Council Bills to effect the tax-financed transfers and assertsthe foundational role of the Drain in Britain’s industrial revolution and the spread of global capitalism with the use of modern macroeconomic concepts. (Patnaik 2017). With India being the second largest earner of export surpluses in the world after the United States, the significance of the Indian tax-financed transfers in fortifying Britain’s position as the world capitalist leader cannot be overestimated.
From the latter half of the nineteenth century as world trade grew faster than world output, there emerged a multilateral trading network expanding across continents and incorporating almost all countries within its ambit by the start of the 20th century. Folke Hilgerdt’s (1942) report on ‘The Network of World Trade’ for the League of Nations reveals that only two regions, viz., United States and the Tropics earned trade surpluses in the multilateral trading network. In sharp contrast, Britain suffered trade deficits with every region in the network barring the Tropics with whom it earned surpluses after which it ended up with an overall trade deficit. In 1928, Britain’s overall trade deficit according to the Report was $1470 million, but this figure excluded many regions and also re-exports. The trade deficit for Britain in 1928 as given in the International Trade Statistics 1900–1960Report (United Nations 1962) and including all the countries, is much higher at $2301 million, with re-exports at $585 million. Two points need to be noted in this regard in order to understand Britain’s leading role in the network despite suffering huge trade deficits. First, Britain could earn its merchandise surpluses from the Tropics alone only because of the captive markets it held in the colonies in the Tropics. Second, apart from these manipulated merchandise surpluses, Britain also had complete control over India’s foreign exchange surpluses earned from the rest of the world, which it transferred to its account by imposing charges exceeding its legitimate invisibles earnings from the latter (Iyer, 2023).
It is in Saul (1960), that the full significance of Indian tax-finance transfers for Britain is revealed. Saul’s assertion that India was key in balancing Britain’s deficits was on point, as the latter financed more than two-fifths of Britain’s overall deficit with the rest of the world, which was around £145 million in 1910, also a figure verifiable from the International Trade Statistics 1900–1960 (United Nations 1962) data. When Saul states that, “…it was mainly through India that the British balance of payments found the flexibility essential to a great capital exporting country.” (ibid., p. 62), it is amply clear that the Indian transfers not only enabled Britain tide over its deficits with the sovereign world but were large enough to also help to finance its capital exports. Notably, these transfers enabled Britain to defy the basic macroeconomic requirement of maintaining a current account surplus in order to undertake capital exports to countries/regions with who it not only suffered trade deficits but also current account deficits, thus incurring balance of payment deficits (Patnaik 2017).
By the triennium 1910-1913 Britain’s re-export trade with the world nearly doubled from its 1870s level and India became an important source of re-exports for Britain (Saul 1960, p. 59). Control over India became even more crucial for Britain as the latter lost markets for its own goods dueto rising tariff barriers from the 1880s by newly developing countries.Since Indian exports faced either minimal or no tariffs from the sovereign world, Britain could continue to keep its markets open for imports from the rest of the world and settle its own payments using India’s rising merchandise surpluses and continue with its capital exports, thereby keeping the multilateral pattern of settlements steady. India was the ‘safety-valve’ through its continuous transfers and ensured that Britain remained steadfastly committed to free trade and did not get de-stabilised due to loss of its export markets in the sovereign world (Iyer 2023).
Patnaik (2013) uses the International Trade Statistics 1900–1960 (United Nations 1962) data to verify Saul’s assertions and shows that India’s trade balances with the rest of the world which financed over 17 percent of Britain’s overall trade deficits in 1900 rose to 40 percent in 1913. Were it not for the Indian transfers, a possible retaliation through tariffs by Britain would have resulted in the loss of an assured market for the United States and industrial countries of Europe and in turn affected their stream of imports. In an interlinked system such as the multilateral network, any pressure such as the collapse of demand even in one end would have led to a cumulative effect on the other intermediary countries as well, disrupting the flow of payments throughout the network and led to its collapse.
Stability in the capitalist system needs fulfilment of at least one of two functions by the world capitalist leader. It should either keep its markets open for imports from capitalist developing countries, to keep up their production and demand or lend capital for their accommodation and development (Kindleberger 1986). The transfers from India helped Britain do both – keep its own markets open for imports from the sovereign countries in keeping with free trade and also export capital to these very countries in defiance of the macroeconomic requirement of possessing a current account surplus in order to export capital. The transfers enabled Britain to respond flexibly as per varying requirements of booms and slumps in the world economy which in turn rendered “sterling and gold virtually interchangeable” (Aldcroft 1981, p.165), lent stability to the gold standard while allowing Britain to maintain low gold reserves (Fearon 1979) and assume the position of being not only “‘regulator of the British monetary system but, in great part, that of regulator of the gold standard and the international payments system.’” (ibid., p.165). The international payments system functioned more or less smoothly to the benefit of Empire until the world agricultural depression from the mid-1920s dealt it a fatal blow.
The First World War disruption to Britain’s leadership and pre-war stability
The stability of multilateral network, existing monetary and trading arrangements and Britain’s leadership came under strain after the First World War. The enormous loss of material resources and human life was compounded by the great influenza pandemic of 1918-1919 which took an estimated 50 to 60 million lives world-wide, a quarter of which were lost in India alone. The 1921 Census showed absolute decline of population compared to 1911, in India proper, excluding Afghanistan and Burma and explains to a large extent the stagnation of central government revenues throughout the 1920s.
Although immediately after the war in 1919, Western Europe and the US experienced a boom of “astonishing dimensions” which was fuelled by “a universal desire to replenish stocks” (Lewis 1969) and the additional purchasing power due to the continuation of high government expenditure following the war, it turned out to be a short-lived one. As soon as shipping revived, the pent-up demand was met by foodstuff and raw material accumulated overseas and prices halved by 1921. The US and France experienced housing and reconstruction related booms from 1922 until 1929, but any such recovery eluded Britain.
The Treaty of Versailles and its imposition of reparations to the extent of $ 33 million and other burdensome conditions on Germany to cover the Allies’ debts, put a spanner in the restoration of demand in the international economy in the aftermath of the war. In the pre-war period, over 50 percent of Germany’s exports had found markets in the Allied countries and its surplus on its invisibles account had more than covered up its $370 million trade deficit. Germany’s ability to pay Reparations however would necessarily impinge upon its own capacity to import from the Allies, making it difficult to restore pre-war trading levels, unless the latter increased their imports from Germany substantially (Keynes 1920).
At a time when the European continent was already fraught with demand deficiency, Britain compounded its problems by choosing to return to the gold standard, which had been suspended during the war, at the pre-war rate in 1925 and pursued self-defeating policies of income deflation in order to maintain parity. Even before the war, the world economy had undergone a change that was to become a challenge for Britain in the post-war era. Britain’s status as the ‘workshop of the world’ had already started waning in the nineteenth century and newly industrialising countries like the United States, Germany and Japan were now competitors in Britain’s export markets for manufactures. The United States had emerged relatively unscathed in the war and had replaced Britain as the leading creditor in the post-war world. Agricultural prices started falling from the second half of the 1920s, and this affected the absorption of British exports in primary producing countries as well. The post-war world posed a serious challenge in Britain’s resurrection to its erstwhile position as the world’s industrial and financial leader.
Mainstream theory explains the decline of Britain in the inter-war period as an outcome of the latter’s inability to cope with the challenges of the external economy. By omitting the role of transfers in their framework of analysis, they fail to see that even in the pre-war period, in the absence of colonial transfers, Britain was in no position to run the multilateral trading and settlements network and the gold standard smoothly. No doubt, the period after the war came with a new set of challenges and Britain’s domestic economy alone was incapable of tackling these. But unlike earlier, in the second half of the inter-war period marking the Depression, Britain’s assured stream of transfers from India also started to dry up. If Britain’s ascent to world leadership was linked to its colonial transfers, its descent too was linked to the same.
Results
Understanding the Inter-war Years: Distinguishing between the two decades
Much of economic history writing on the inter-war years is riddled with conceptual and factual flaws and inaccuracies. Moreover, since mainstream economic history refuses to acknowledge, let alone understand the role of colonial transfers in the rise of Britain as the world capitalist leader, the inter-war years that initially witnessed an agricultural downturn and soon enough a decade long period of depression, are summarily dubbed as a phase of India’s decolonization (Tomlinson 1979, Gallagher and Seal 1981).
In the first decade of the inter-war period, although world agricultural prices started declining from 1925 onwards, Indian peasantry in a bid to maintain their earnings countered the worldwide trend by expanding volumes (Varshney 1965). As a result, there was a surge in India’s commodity export surpluses upto 1928 despite a worldwide fall in agricultural prices from 1925 onwards and continued to remain the second highest export surplus earning country (Iyer 2021). Tax-financed transfers from India continued unabated during this decade and now interest payments became a regular source of increased drain of wealth from India. The war years added to India’s debt burden as the colonial government passed a special resolution in Parliament to enable use of India’s revenues for the maintenance of its troops sent to fight the Empire’s war on various fronts of more than £ 145 million (Shah 1921). Consequentially, interest payments rose five-fold from about £1.5 million to nearly £8 million between 1913-14 and 1918 19 (Shah ibid., p.364).
Interest payments continuously rose in the inter-war period, with the annual average rising from over £14 million in 1924-25 to nearly £16 million in 1933-34. Of the total invisible payments made by India during the inter-war period, interest payments averaged at over 60 percent, which meant that over 2 percent of the national income went towards meeting interest obligations. In the 1930s nearly 3 percent of British India’s national income went into debt servicing.While on an average, interest payments wiped out 68 percent of India’s commodity trade surplus for the 1920s, in the 1930s this figure rose about 2.5 times to a whopping 168 percent, thus furthering India’s debt spiral (Iyer 2021).
By 1925, India’s merchandise surpluses were however able to finance only 26.5 percent of Britain’s trade deficits with the rest of the world, as opposed to 40 percent in 1913. In the 1930s, India could no longer buck the worldwide recession in agriculture that soon led to even more rapidly falling prices and industrial depression from 1929. India saw a steep fall in its commodity export surpluses in the 1930s. India’s merchandise surpluses could only finance 7.1 percent in 1935 which rose only slightly to 9 percent in 1938. (Patnaik 2013). This posed a serious threat to Britain’s vulnerable post-war position in the world economy and in particular to the restoration of the gold standard and the multilateral payments network. With international confidence waning in Britain’s ability to coordinate the multilateral system and hence in the gold standard, the latter broke down.
Notably,Britain’s industrial status had been waning since the end of the nineteenth century and its inability to take on the newly industrialised countries such as the United States, Japan and Germany, was seen in the fall in its share of world exports in manufactures from 38 percent in 1876-60 to 27 percent by 1911-13, when world trade was expanding (Lewis 1969). The war, by pushing countries to towards import substitution, further reduced Britain’s earnings from export of manufactures and invisibles. Britain tried to adapt itself to the changing world situation, witnessed in the changing composition of its exports between the early nineteenth century and the pre-war years, but its efforts had proved to be insufficient vis-à-vis newly industrializing countries like the US. Additionally, since 40 percent of Britain’s exports was absorbed by primary producing countries, a fall in the latter’s export prices made it difficult to keep up their share of British imports (Fearon 1979). There were further challenges to Britain’s exports following the end of the war with new competitors in industry and trade and a collapsing multilateral network giving way to bilateralism and tariff barriers (Arndt 2013).
Despite an improvement in its terms of trade due to falling primary product prices, Britain’s attempt to continue keeping its own markets open for imports of primary goods and manufactures amidst falling exports, led to a current account deficit. During the inter-war period, Britain’s merchandise deficit averaged £ 348 million per annum. While in the 1920s, it was the increase in its invisible earnings (which included the drain items from India) that kept its current account in surplus, a fall in the same left its current account in deficit for most of the 1930s. Within a period of two years, from 1929 to 1931, a fall in the value of its merchandise exports by over 45 per cent along with a fall in its invisible balance by 42.5 percent brought down Britain’s current account surplus of £ 101.2 million pounds to a deficit of £ 103 million pounds (Calculated from Thirlwall and Gibson, 1992, Table 9.1, pp.202-203).
In Table 1 below, we have calculated the indices related to Britain’s trade in goods and services during the inter-war period, with 1922 as the base year. With indices, we can easily infer the percentage change in value over the years when compared to 1922. We can see that over the 1920s the value of merchandise imports rose faster than that of exports producing a deficit on Britain’s merchandise account as wasthe case in earlier decades as well. The value of exports startedfalling faster from 1930 and was 58 percent of the 1922 value by 1932 and 1933. Moreover, unlike a continuous rise in the invisibles index that kept the current account in surplus in the 1920s, in the 1930s, an accompanying fall in the invisibles index until 1935 left the current account in deficit.
Table 1: Indices of Merchandise Imports, Exports, Merchandise Deficit and Net Invisibles, Britain 1922 to 1939. (1922=100).
Year | Merchandise | Merchandise | Merchandise | Net Invisibles |
1922 | 100 | 100 | 100 | 100 |
1923 | 109.3 | 122.5 | 75.2 | 107.1 |
1924 | 127.3 | 130.0 | 120.5 | 126.2 |
1925 | 131.7 | 128.2 | 140.5 | 134.8 |
1926 | 123.8 | 107.6 | 165.4 | 138.2 |
1927 | 173.6 | 115.1 | 138.0 | 144.3 |
1928 | 119.2 | 116.7 | 125.7 | 146.2 |
1929 | 121.7 | 116.0 | 136.4 | 148.6 |
1930 | 104.1 | 90.9 | 138.0 | 127.4 |
1931 | 85.9 | 62.8 | 145.3 | 93.5 |
1932 | 70.0 | 57.5 | 102.1 | 72.6 |
1933 | 67.3 | 57.7 | 92.2 | 80.9 |
1934 | 72.9 | 61.8 | 101.5 | 88.3 |
1935 | 75.4 | 66.5 | 98.2 | 90.2 |
1936 | 84.5 | 69.3 | 123.8 | 100.6 |
1937 | 102.5 | 82.5 | 154.1 | 118.8 |
1938 | 91.7 | 73.6 | 138.3 | 99.1 |
1939 | 88.3 | 67.1 | 142.9 | - |
Source: Calculated from Table 9.1 Thirwall A.P and Heather D. Gibsom (1992).
Note: Merchandise balance was calculated and therefore differs from the source.
Unlike the twenties, in the thirties, on an average the current account was in deficit and repayments from abroad surpassed new overseas investments. “...More than ever, the country was living on its fat.” (Mowat 1968, p.435) Between 1922 and 1929, foreign investment averaged around £123 million. In the thirties, it almost halved and averaged a little over £66 million (Kindersley 1937, p. 661). Despite a discouraging external balance and falling reserves, Britain continued to keep up its pre-war role of making long-term loans by resorting to short term borrowings. In the pre-war era, Britain could afford to lend long with low level of reserves, because of the confidence in the international market that its balance of payments position was immune to any vulnerability. The post-war period from the second half of the 1920s offered no such complementary conditions. Having restored the pound sterling on the gold standard at pre-war parity in 1925, the pressure to maintain parity led Britain to adopt severe deflationary measures, including massive expenditure cuts in the twenties. These deflationary measures operated by exerting a downward pressure on prices and wages in Britain and leading to unemployment and labour unrest even before the Depression set in with the 1929 stock market crash. Financial orthodoxy and pursuit of deflationary measures continued well into the crisis (see Kindleberger 1986, chapters 6 to 8).
Britain’s dogged adherence to fiscal orthodoxy and principles of sound finance in the 1920s, resulted in unemployment which remained at one million throughout the inter-war years. The worst fall that took place was between 1929 and 1932, where the insured unemployed as a proportion of the total insured peaked at 22 percent, and production had declined by 15 percent. (MacDougal 1938, Table 1, p.6) Even as late as 1937, unemployment remained at nearly 24 percent in Northern Ireland and above 22 percent in Wales (Mowat 1968). Areas which were heavily dependent on exports, of coal, steel, textiles and shipping, which included the areas such as Scotland, Wales, Lancashire and Northern Ireland were the worst off. The widening inequality between England and these distressed areas which suffered higher figures of malnutrition, illness and mortality, led to the 1930s being dubbed as the ‘hungry thirties’ and also gave birth to the Scottish nationalist movement.
Discussion
Unravelling Britain’s early recovery from the Depression
An examination of data for the second half of the thirties shows an improvement compared to 1929 in the index of production but less so in employment. By 1937, production was 24 percent higher than in 1929, although nearly 11 percent of the insured remained unemployed (MacDougal 1938). According to some mainstream scholars like Richardson (1972) who hold a ‘revisionist’ view, though Britain was subject to the same exogenous shocks as the rest of the world during the inter-war period, the amplitude of the fluctuations was relatively ‘damped’ in the former and its recovery from the Depression in the 1930s, was more complete than other countries. As per this view the fact that Britain’s slump originated in its export sector worked in its favour during its recovery, since the scope for domestic investment had not been exhausted as in the US. Additionally, Britain witnessed a relative stability of aggregate consumption during the early 1930s which helped in domestic recovery through growth in demand for electrical appliances, motor cars, electricity and housing (Richardson 1972).
The ‘revisionist’ theorists broadly argue that Britain benefitted from a dual transfer effect that stabilised its aggregate consumption during the Depression years. Firstly, a transfer of income occurred from the unemployed whose wages dropped to zero to the employed whose real incomes remained stable as the fall in prices fell faster than money wages. Secondly, the addition to disposable income took place through an improvement in Britain’s terms of trade. Although the falling primary product prices may have adversely affected demand for British exports, “...[t]he price index of exported manufactures/imported foodstuff rose from 90 in 1929 (1930 = 100) to 114 in 1933 and stayed almost at this peak until 1936, reflecting the very heavy drop in the average price of imported foodstuffs (almost 39 per cent between 1929 and 1933).” (Richardson 1972, p.176) The falling price of imported foodstuffs resulted in a gain in purchasing power. The terms of trade effect grew stronger in the 1930s as prices of imports fell further. Additionally, in the 1930s, a change in the composition of taxes took place in that the share of taxes on income and property in total tax revenue fell from nearly 43.5 percent to 40.5 percent while the share of customs receipts rose from 17.2 to 26.5 percent between 1929 and 1936. This changing tax composition, argues Richardson, may have also helped in reallocating consumption expenditure from non-durables to durables, electrical appliances being one such case in point.
The improvement in the terms of trade, according to the ‘revisionist’ theorists, is said to have contributed to the increase in Britain’s national income by about 5 percent and an increase of around 3 percent in average real income of working persons between 1929 and 1933 (MacDougall 1938, p.20). A representative unit of commodity exports between 1931 and 1935 is said to have fetched for Britain a volume of imports 20 percent greater than before the slump (Arndt 2013). This saving on the cost of imported food and other necessaries, “…is estimated to have released some £250 million of consumers’ purchasing power which became available for expenditure on houses and other 'luxuries', such as motor cars (the sale of which increased by 50 per cent between 1930 and 1936) (Arndt 2013, p.131). Further, the fall in cost of imports was supposedly supplemented by a fall in the cost of living from 1929 until 1933 by about 15 percent, whereas wage rates for the same period fell by about 5 percent. In the period between 1933 and 1937, a 10 percent increase in the cost of living index was accompanied by a parallel increase in wage rates by about 10 percent. Over the entire period from 1929-1937, wage rate is said to have increased by 4 percent (MacDougall 1938, pp.79-81).
In other words, the ‘revisionist’ view dismisses the conventional view offered by Lewis and others as too ‘pessimistic’ and attributes Britain’s relative stability and recovery from the Depression to a set of fortuitous circumstances that were capitalized upon. Others like Moggridge (1972) also attribute Britain’s growth after 1924 to “‘autonomous’ impulses” in a number of domestic industries that had been built upon and helped counter to a great extent the loss of its export markets. As has been the norm in mainstream history writing of this period, just as Britain had undergone the industrial revolution under its own steam, its survival and recovery from the Depression too was supposedly on its own accord. There is no reference to the flow of colonial transfers during this period, which played a crucial role particularly in the 1930s, when Britain’s invisible earnings were increasingly unstable and compounded its widening trade deficit woes.
An examination of facts however runs counter to the ‘revisionists’’ claims. The transfers from India while continuing to keep the latter’s current account negative in the 1920s had helped Britain’s invisibles account remain steady and contributed to its positive current account amidst rising trade deficits. Interest payments in sterling made up the largest component of India’s total Invisibles payments administratively imposed by Britain, to offset its appropriation of India’s entire export surplus earnings from the world. To get an idea of their importance for Britain, in Tables 2 to 5 India’s interest payments and total invisibles payments, over the period 1921-22 to 1938-39 have been expressed as a) share of India’s interest payments in Britain’s investment earnings abroad, b) Share of India’s interest payments and Invisibles Payments in Britain’s Invisibles incomes, c) Share of India’s Interest Payments and Invisibles payments in Britain’s Merchandise Deficit and in Britain’s total invisibles income.
Table 2: Share of India’s interest payments in Britain’s Foreign Investment Income, 1922 to 1938.
Year | Exchange (1) | Exchange (2) | Britain's Overseas | Britain's Overseas (4) | India's Interest (5) | India's Interest (6) | Share of India's (7) |
1922 | 3.470 | 4.426 | 175 | 774.6 | 516.3 | 148.8 | 19.2 |
1923 | 3.211 | 4.574 | 200 | 914.8 | 568.1 | 176.9 | 19.3 |
1924 | 3.142 | 4.418 | 220 | 971.9 | 579.1 | 184.3 | 19.0 |
1925 | 2.749 | 4.829 | 250 | 1207.1 | 562.9 | 204.8 | 17.0 |
1926 | 2.753 | 4.858 | 250 | 1214.6 | 543.4 | 197.4 | 16.3 |
1927 | 2.754 | 4.861 | 250 | 1215.3 | 597.3 | 216.9 | 17.8 |
1928 | 2.740 | 4.867 | 250 | 1216.7 | 532.9 | 194.5 | 16.0 |
1929 | 2.740 | 4.867 | 250 | 1216.7 | 524.9 | 191.6 | 15.7 |
1930 | 2.740 | 4.867 | 220 | 1070.6 | 443.8 | 162.0 | 15.1 |
1931 | 3.173 | 4.537 | 170 | 771.2 | 425.5 | 134.1 | 17.4 |
1932 | 3.812 | 3.505 | 150 | 525.8 | 425.4 | 111.6 | 21.2 |
1933 | 3.194 | 4.244 | 160 | 679.0 | 458.5 | 143.6 | 21.1 |
1934 | 2.689 | 5.035 | 170 | 855.9 | 449.6 | 167.2 | 19.5 |
1935 | 2.679 | 4.927 | 185 | 911.4 | 480.4 | 179.3 | 19.7 |
1936 | 2.671 | 4.978 | 200 | 995.6 | 507.6 | 190.0 | 19.1 |
1937 | 2.665 | 4.945 | 210 | 1038.5 | 506.0 | 189.9 | 18.3 |
1938 | 2.788 | 4.887 | 200 | 977.3 | 478.8 | 171.7 | 17.6 |
TOTAL | - | - | 3510 | 16557.0 | 8600.5 | 2964.6 | - |
AVERAGE | 2.939 | 4.684 | 206.5 | 973.9 | 505.9 | 174.4 | 18.2 |
Source: Columns (1) and (2) taken from United Nations Trade Statistics, 1900-1960 (1962), Column (5) from A.K Banerjee (1963). India’s Balance of Payments: Estimates of Current and Capital Accounts from 1921-22 to 1938-39. Asia Publishing House.
We find from Column 7 in Table 2 that India’s interest payments accounted for over 18 percent per annum of Britain’s earnings from its investment abroad. In the 1920s, there was a fall in India’s share of interest payments in Britain’s investment income from over 19 percent in the triennium ending in 1924 to about 16 percent in the triennium ending in 1930. But in the next decade, although in absolute terms India’s interest payments show a fall, its share in Britain’s falling overseas investment income in this period increased. In 1932 and 1933 India’s interest payments accounted for over 21 percent of Britain’s investment income and over the next two years continued to be about one-fifth of Britain’s overseas investment earnings.
Table 3: Share of India’s interest payments and Invisibles Payments in Britain’s Invisibles, 1922 to 1938.
Year | Britain's Net (1) | India's Interest (2) | India's Net (3) | Share of India's (4) | Share of India's (5) |
1922 | 1438.6 | 148.8 | 257.1 | 10.3 | 17.9 |
1923 | 1591.8 | 176.9 | 311.5 | 11.1 | 19.6 |
1924 | 1811.3 | 184.3 | 324.0 | 10.2 | 17.9 |
1925 | 2114.9 | 204.8 | 373.1 | 9.7 | 17.6 |
1926 | 2181.3 | 197.4 | 147.9 | 9.1 | 6.8 |
1927 | 2279.8 | 216.9 | 330.9 | 9.5 | 14.5 |
1928 | 2311.6 | 194.5 | 325.6 | 8.4 | 14.1 |
1929 | 2350.6 | 191.6 | 238.5 | 8.2 | 10.1 |
1930 | 2014.7 | 162.0 | 256.6 | 8.0 | 12.7 |
1931 | 1379.1 | 134.1 | 235.3 | 9.7 | 17.1 |
1932 | 827.2 | 111.6 | 208.9 | 13.5 | 25.3 |
1933 | 1116.1 | 143.6 | 311.0 | 12.9 | 27.9 |
1934 | 1445.0 | 167.2 | 318.8 | 11.6 | 22.1 |
1935 | 1443.5 | 179.3 | 192.5 | 12.4 | 13.3 |
1936 | 1627.8 | 190.0 | 303.6 | 11.7 | 18.6 |
1937 | 1908.9 | 189.9 | 290.2 | 9.9 | 15.2 |
1938 | 1573.5 | 171.7 | 272.8 | 10.9 | 17.3 |
TOTAL | 29415.7 | 2964.6 | 4698.2 | - | - |
AVERAGE | 1730.3 | 174.4 | 276.4 | 10.4 | 16.9 |
Source: Column (1) from Table 1 and converted using exchange rates given in Table 2, Column (3) from A.K Banerjee (1963) given in rupees and converted using exchange rates in Table 2.
Note: India’s net invisibles payments are net CIF.
Columns 1, 2 and 3 in million dollars.
In Table 3 above, India’s invisibles payments have been calculated after deducting CIF or Cost, Insurance and Freight payments. By doing so we have deducted the regular or normal invisibles payments that any sovereign country would have to bear and therefore Column 3 shows the administered invisibles debited from India.Indian transfers by way of administered invisibles payments which on average annually financed 17 percent of Britain’s invisibles earnings over the entire period 1922 to 1938, played a far more significant role in Britain’s falling invisibles earnings in the 1930s. In the years 1932 and 1933, India’s administered invisibles payments financed more than a quarter and 28 percent respectively of Britain’s invisibles income which had fallen to its lowest levels over the entire period. One component of India’s invisible payments, namely interest payments (Column 2) alone contributed more than 10 percent per annum to Britain’s overall invisibles earnings in the period 1922-1938, again with 1932 to 1935 registering a higher-than-average contribution. In other words, at a time, when Britain’s investments in the sovereign capitalist world were no longer reaping their dividends, India’s ‘colonial’ contribution and relevance had increased rather than diminished even in the Depression-ridden half of the inter-war years.
As per the ‘revisionists’ claim, Britain may have experienced an improvement in its terms of trade in the Depression years, but in order for this to have translated into greater domestic spending, it should have resulted in a lower spending on imports for a given level of exports and a consequent lowering of the merchandise deficit. But in Table 1, we see the merchandise exports index falling at a faster rate than the merchandise imports index in the 1930s and a widening of the merchandise deficit when compared with 1922. By 1926, Britain’s merchandise deficit was 65 percent higher than its 1922 level. In the thirties, the merchandise deficit fell slightly below the 1922 level only for a couple of years, viz., 1933 and 1935. By 1936 it was 24 percent and by 1937 the merchandise deficit was over 54 percent higher than 1922. If Britain was able to generate any ‘savings’ that was diverted towards domestic spending, it was by no means because of a terms of trade effect. Rather, just as in the past, Britain paid its way out of its growing merchandise deficit through colonial transfers.
Table 4: Share of India’s Interest Payments in Britain’s Merchandise Deficit, 1921-22 to 1938-39.
Year | Britain’s (1) | Exchange (2) | India’s Interest (3) | India’s Interest (4) | Share of India’s (5) |
1921-22 | -1049 | 3.814 | 450.0 | 118.0 | 11.2 |
1922-23 | -776 | 3.470 | 516.3 | 148.8 | 19.2 |
1923-24 | -950 | 3.211 | 568.1 | 176.9 | 18.6 |
1924-25 | -1493 | 3.142 | 579.1 | 184.3 | 12.3 |
1925-26 | -1890 | 2.749 | 562.9 | 204.8 | 10.8 |
1926-27 | -2248 | 2.753 | 543.4 | 197.4 | 8.8 |
1927-28 | -1877 | 2.754 | 597.3 | 216.9 | 11.6 |
1928-29 | -1716 | 2.740 | 532.9 | 194.5 | 11.3 |
1929-30 | -1852 | 2.740 | 524.9 | 191.6 | 10.3 |
1930-31 | -1879 | 2.740 | 443.8 | 162.0 | 8.6 |
1931-32 | -1815 | 3.173 | 425.5 | 134.1 | 7.4 |
1932-33 | -1001 | 3.812 | 425.4 | 111.6 | 11.1 |
1933-34 | -1113 | 3.194 | 458.5 | 143.6 | 12.9 |
1934-35 | -1477 | 2.689 | 449.6 | 167.2 | 11.3 |
1935-36 | -1281 | 2.679 | 480.4 | 179.3 | 14.0 |
1936-37 | -1713 | 2.671 | 507.6 | 190.0 | 11.1 |
1937-38 | -2185 | 2.665 | 506.0 | 189.9 | 8.7 |
1938-39 | -1840 | 2.788 | 478.8 | 171.7 | 9.3 |
TOTAL | -28155 | - | 9050.5 | 3082.6 | - |
AVERAGE | -1564.2 | 2.955 | 502.8 | 171.3 | 11.6 |
Source: Column (1) has been taken from International Trade Statistics 1900–1960 (United Nations 1962), Column (3) from A.K. Banerjee (1963) given in rupees and converted using exchange rates in Column (2) as given in International Trade Statistics 1900–1960 (United Nations 1962).
In Table 4 we see that over the entire inter-war period 1921-22 to 1938-39, India’s interest payments alone helped finance around 12 percent of Britain’s merchandise deficit annually, peaking in 1922 -23 at over 19 percent (Figure 1). From 1921 to 1929, Indian interest payments financed about 13 percent of Britain’s merchandise deficit annually, and 11 percent from 1930 to 1938. In the decade of the 1930s, the share of interest payments in Britain’s merchandise deficit was maximum at 14 percent in 1935-56 (Figure 1).
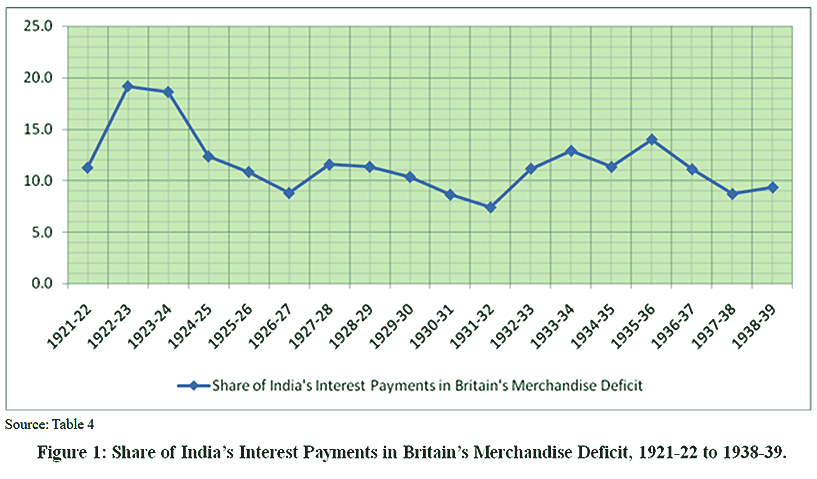 | Figure 1: Share of India’s Interest Payments in Britain’s Merchandise Deficit, 1921-22 to 1938-39. |
Source: Table 4.
Barring 1932-33, India’s interest payments throughout the entire period far exceeded the payments in the beginning of the period, and peaked in 1927-28 at $217 million, nearly 84 percent higher than the 1921-22 level. We observe in Figure 2 below, the graphs of the indices of Britain’s merchandise deficit and India’s interest payments moving in tandem, indicating India’s growing debt and interest burden in correspondence with Britain’s increasing deficits.
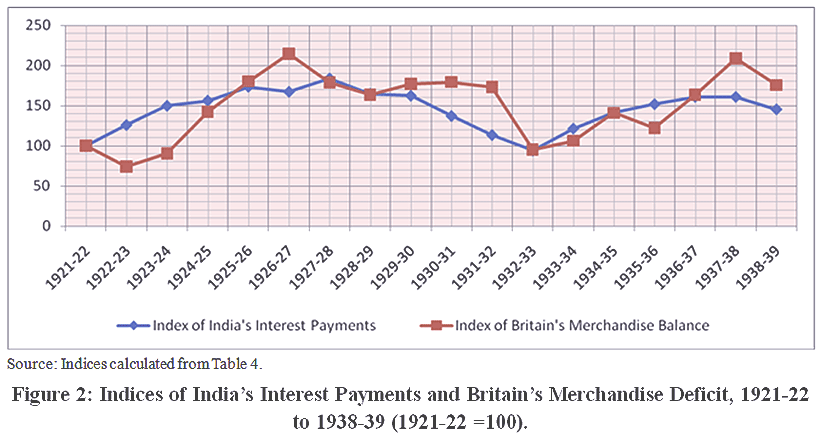 | Figure 2: Indices of India’s Interest Payments and Britain’s Merchandise Deficit, 1921-22 to 1938-39 (1921-22 =100). |
Source: Indices calculated from Table 4.
Over the inter-war period, Britain annually financed 19 percent or almost one-fifth of its merchandise deficit through India’s invisibles payments (Table 5). Even when India’s own export earnings took a hit in the 1930s, the annual share of Indian transfers in Britain’s trade deficit only fell slightly to about 18 percent. Peaking in the first triennium 1921-23, at over 27 percent, the three-year annual average fell to 16 percent for the next three triennia (1924-26, 1927-29 and 1930-32) before rising again to meet 22 percent of Britain’s merchandise deficit in 1933-35.(Figure 3).
Table 5: Share of India’s invisibles payments in Britain’s Merchandise Deficit, 1921-22 to 1938-39.
Year | Britain’s (1) | Exchange (2) | India's Net (3) | India's Net (4) | Share of India’s (5) |
1921-22 | -1049 | 3.814 | 573.0 | 150.2 | 14.3 |
1922-23 | -776 | 3.470 | 892.2 | 257.1 | 33.1 |
1923-24 | -950 | 3.211 | 1000.2 | 311.5 | 32.8 |
1924-25 | -1493 | 3.142 | 1018.0 | 324.0 | 21.7 |
1925-26 | -1890 | 2.749 | 1025.6 | 373.1 | 19.7 |
1926-27 | -2248 | 2.753 | 407.0 | 147.9 | 6.6 |
1927-28 | -1877 | 2.754 | 911.4 | 330.9 | 17.6 |
1928-29 | -1716 | 2.740 | 892.0 | 325.6 | 19.0 |
1929-30 | -1852 | 2.740 | 653.4 | 238.5 | 12.9 |
1930-31 | -1879 | 2.740 | 702.9 | 256.6 | 13.7 |
1931-32 | -1815 | 3.173 | 746.6 | 235.3 | 13.0 |
1932-33 | -1001 | 3.812 | 796.4 | 208.9 | 20.9 |
1933-34 | -1113 | 3.194 | 993.2 | 311.0 | 27.9 |
1934-35 | -1477 | 2.689 | 857.3 | 318.8 | 21.6 |
1935-36 | -1281 | 2.679 | 515.6 | 192.5 | 15.0 |
1936-37 | -1713 | 2.671 | 810.8 | 303.6 | 17.7 |
1937-38 | -2185 | 2.665 | 773.5 | 290.2 | 13.3 |
1938-39 | -1840 | 2.788 | 760.4 | 272.8 | 14.8 |
TOTAL | -28155 | - | 14329.5 | 4848.4 | - |
AVERAGE | -1564.2 | 2.955 | 796.1 | 269.4 | 18.6 |
Source: Columns (1) and (2) from International Trade Statistics 1900–1960 (United Nations 1962), Column (3) from A.K Banerjee (1963).
Note: India’s net invisibles are net CIF.
Figure 3: Share of India’s invisibles payments in Britain’s Merchandise Deficit, 1921 to 1938 (Three year annual averages).
Source: Indices calculated from Table 5
When India’s merchandise surpluses, fell short of the former’s requirements, to ensure the continued flow of transfers, the colony was made to pay through a sale of the Indian assets. Indian peasantry who faced rising rent, debt and revenue obligations amidst continuously falling agricultural prices in the 1930s and a slew of income deflationary measures unleashed by the colonial regime, were forced into a distress driven sale of their gold assets. Between 1931 and 1938, over Rs. 3.5 billion worth of financial gold exports from India was recorded for the first time in history and played a crucial role in the early revival of Britain’s domestic economy from the Depression and helped it stay afloat (Iyer 2023).
The drain of wealth from India which continued unabated, under the challenging conditions of the inter-war period, could not restoreBritain to its pre-war glory, yet these transfers softened the blow of the Depression by helping the lattermake a relatively earlier recovery than its capitalist counterparts and stay afloat during capitalism’s crisis years.
Conclusion
Mainstream accounts of Britain’s ability to weather and recover earlier from the crisis as compared to other affected countries attribute ‘autonomous impulses’ or a spontaneous domestic recovery aided by improved terms of trade and a fall in the domestic cost of living. These are incomplete explanations and omitting the role of colonial transfers from the analysis is akin to cherry-picking of facts. The main factor that distinguished Britain from other sovereign countries affected by the crisis was the continued presence of colonial transfers. Britain emerged industrially and financially weaker from the war, while the United States had replaced the former as the main creditor during the War. Yet, India’s transfers had ensured that Britain could continue to invest abroad despite witnessing widening trade deficits and unlike other sovereign countries going through the crisis, Britain’s weakened external sector posed no destabilizing threat to its home economy.
Extracting these transfers took place involved an imposition of income deflation through taxation and surplus budgets, a mechanism used to extract colonial transfers from India that has remained a policy prescription in the modified form of ‘austerity’ till date for developing countries imposed by the developed world, even in the absence of the edifice of colonialism. The findings of this paper therefore not only challenge the dominant mainstream narrative on the historical origins and evolution of global capitalism but also establish a continuity in the operative mechanism of capitalism in crisis in contemporary times.
Acknowledgement
The author would like to acknowledge Prof. Utsa Patnaik for her valuable inputs for this research. All errors are mine.
Funding Sources
The author(s) received no financial support for the research, authorship, and/or publication of this article.
Conflict of Interest
The author does not have any conflict of interest.
Data Availability Statement
All data used in the paper has been referenced appropriately with source details below each table and figure. There is no copyright violation and the data is open access.
Ethics Statement
This research does not involve human participants, animal subjects, or any material that requires ethical approval.
Informed Consent Statement
This study does not involve human participants, and therefore, informed consent was not required.
Clinical Trial Registration
This research does not involve any clinical trials.
Permission to reproduce material from other sources
All data and text sources used in the manuscript have been duly credited and referenced. The sources for the data and text used are open source and for public access and do not lead to any copyright violation.
Author Contributions
The sole author was responsible for the conceptualization, methodology, data collection, analysis, writing and final approval of the manuscript.
References
- Naoroji, D. (1901). Poverty and un-British rule in India. Swan Sonnenschein & Co.
- Dutt, R. C. (1902). The economic history of India under early British rule: From the rise of the British power in 1757 to the accession of Queen Victoria in 1837 (Vol. 1). Kegan Paul.
- Habib, S. (1975). Colonial exploitation and capital formation in England in the early stages of industrial revolution. In Proceedings of the Indian History Congress. Indian History Congress.
- Patnaik, U. (2006). The free lunch: Transfers from the tropical colonies and their role in capital formation in Britain during the Industrial Revolution. In J. K. Sundaram (Ed.), Globalization under hegemony: The changing world economy (pp. 30-70). Oxford University Press.
- Patnaik, U. (1984). Tribute transfer and the balance of payments. Social Scientist, 12(12). Reprinted in U. Patnaik (1999), The long transition: Essays on political economy (pp. 305–322). Tulika Books.
CrossRef - Patnaik, U. (2017). Revisiting the “drain,” or transfers from India to Britain in the context of global diffusion of capitalism. In S. Chakrabarti & U. Patnaik (Eds.), Agrarian and other histories: Essays for Binay Bhushan Chaudhuri. Tulika Books.
- Hilgerdt, F. (1942). The network of world trade: A companion volume to Europe’s trade. League of Nations.
- International Trade Statistics 1900–1960. (1962, May). Statistical Office of the United Nations. https://unstats.un.org/unsd/trade/ data/tables. asp#historical
- Iyer, V. (2023). A tangible concept of imperialism: Utsa Patnaik’s estimates of colonial transfers from India. The Indian Economic Journal, 71(1), 229-246. DOI: 10.1177/00194662221146647
CrossRef - Saul, S. B. (1960). Studies in British overseas trade, 1870–1914. Liverpool University Press.
- Patnaik, U. (2013). India in the world economy, 1900–1935: The inter-war depression and Britain’s demise as world capitalist leader. Proceedings of the Indian History Congress, 74, 682–702.
- Kindleberger, C. P. (1986). The world in depression, 1929–1939. University of California Press.
- Aldcroft, D. H. (1981). From Versailles to Wall Street, 1919–1929. University of California Press.
- Lewis, W. A. (1969). Economic survey, 1919–1939. Harper & Row.
- Keynes, J. M. (1920). The economic consequences of the peace. Harcourt, Brace and Howe.
- Tomlinson, B. R. (1979). The political economy of the Raj, 1914–1947: The economics of decolonization in India. Macmillan.
CrossRef - Gallagher, J., & Seal, A. (1981). Britain and India between the wars. Modern Asian Studies, 15(3), 387–414.
CrossRef - Varshney, R. L. (1965). Foreign trade. In V. B. Singh (Ed.), Economic history of India, 1857–1956. Allied Publishers.
- Iyer, V. (2021). India and Britain in the world economy during the inter-war years (Unpublished doctoral dissertation). Jawaharlal Nehru University.
- Shah, K. T. (1921). Sixty years of Indian finance. Bombay Chronicle Press.
- Fearon, P. (1979). The origins and nature of the Great Slump, 1929–1932. Macmillan.
CrossRef - Arndt, H. W. (2013). The economic lessons of the nineteen-thirties. Routledge.
- Thirlwall A.P., & Gibson, Heather D. (1992). A history of the UK balance of payments. In A.P. Thirlwall and H.D. Gibson, Balance of payments theory and the United Kingdom experience. Palgrave Macmillan.
CrossRef - Mowat, C. L. (1968). Britain between the wars, 1918–1940. Methuen.
- Kindersley, R. M. (1937). British oversea investments in 1935 and 1936. The Economic Journal, 47(188), 661–672.
CrossRef - MacDougall, G. D. A. (1938). General survey, 1929–1937. In Britain in recovery. Sir Isaac Pitman & Sons.
- Richardson, H. W. (1972). The role of consumption in interwar fluctuations. In D. H. Aldcroft& P. Fearon (Eds.), British economic fluctuations, 1790–1939. Macmillan.
CrossRef - Moggridge, D. E. (1972). British monetary policy, 1924–1931: The Norman conquest of 4.86. Cambridge University Press.
- Banerjee, A.K. (1963). India’s Balance of Payments: Estimates of Current and Capital Accounts from 1921-22 to 1938-39. Asia Publishing House.
- Iyer, V. (2023). Bailout for Britain: A re-examination of gold flows in India during the inter-war years. Economic and Political Weekly, 58(14), 46–52.

This work is licensed under a Creative Commons Attribution 4.0 International License.